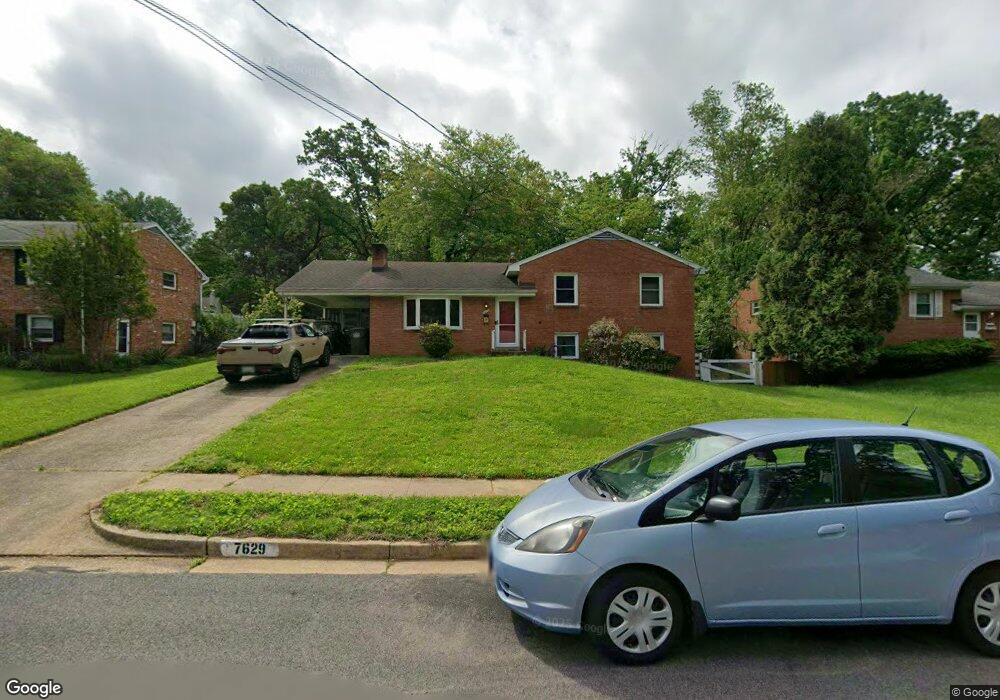
7629 Webbwood Ct Springfield, VA 22151
Estimated Value: $658,000 - $665,346
About This Home
This home is located at 7629 Webbwood Ct, Springfield, VA 22151 and is currently estimated at $661,673, approximately $525 per square foot. 7629 Webbwood Ct is a home located in Fairfax County with nearby schools including North Springfield Elementary School, Holmes Middle School, and Annandale High School.
Ownership History
We collect this data history from publicly available records. To have your information removed, we recommend requesting removal directly through your county’s website.
Purchase Details
Home Financials for this Owner
Home Financials are based on the most recent Mortgage that was taken out on this home.Purchase Details
Home Values in the Area
Average Home Value in this Area
Purchase History
We collect this data history from publicly available records. To have your information removed, we recommend requesting removal directly through your county’s website.
| Date | Buyer | Sale Price | Title Company |
|---|---|---|---|
| $175,000 | -- | ||
| -- | -- |
Mortgage History
We collect this data history from publicly available records. To have your information removed, we recommend requesting removal directly through your county’s website.
| Date | Status | Borrower | Loan Amount |
|---|---|---|---|
| Open | $100,000 |
Tax History
We collect this data history from publicly available records. To have your information removed, we recommend requesting removal directly through your county’s website.
| Year | Tax Paid | Tax Assessment Tax Assessment Total Assessment is a certain percentage of the fair market value that is determined by local assessors to be the total taxable value of land and additions on the property. | Land | Improvement |
|---|---|---|---|---|
| 2025 | $6,856 | $623,140 | $280,000 | $343,140 |
| 2024 | $6,856 | $591,800 | $265,000 | $326,800 |
| 2023 | $6,498 | $575,820 | $255,000 | $320,820 |
| 2022 | $6,220 | $543,980 | $225,000 | $318,980 |
| 2021 | $5,943 | $506,430 | $207,000 | $299,430 |
| 2020 | $5,558 | $469,660 | $207,000 | $262,660 |
| 2019 | $5,558 | $469,660 | $207,000 | $262,660 |
| 2018 | $5,126 | $445,780 | $207,000 | $238,780 |
| 2017 | $4,956 | $426,830 | $195,000 | $231,830 |
| 2016 | $4,829 | $416,830 | $185,000 | $231,830 |
| 2015 | $4,521 | $405,080 | $180,000 | $225,080 |
| 2014 | $4,417 | $396,670 | $176,000 | $220,670 |
Map
- 7669 Long Pine Dr
- 5759 Heming Ave
- 7500 Long Pine Dr
- 7411 Ellwood Place
- 5609 Sedgwick Ln
- 5512 Kathleen Place
- 5506 Joplin St
- 5419 Kempsville St
- 7740 Carrleigh Pkwy
- 7517 Axton St
- 6110 Harmon Place
- 5816 Amelia St
- 6112 Harmon Place
- 5807 Accomac St
- 6006 Merryvale Ct
- 6117 Harmon Place
- 7418 Blackford St
- 7212 Highland St
- 5643 Inverchapel Rd
- 5414 Queensberry Ave
- 7627 Webbwood Ct
- 7629 Long Pine Dr
- 7625 Webbwood Ct
- 7633 Long Pine Dr
- 7631 Webbwood Ct
- 7627 Long Pine Dr
- 7630 Webbwood Ct
- 7626 Webbwood Ct
- 7624 Long Pine Dr
- 7633 Webbwood Ct
- 7623 Webbwood Ct
- 7625 Long Pine Dr
- 7635 Long Pine Dr
- 5709 Heming Ave
- 7624 Webbwood Ct
- 5713 Heming Ave
- 7623 Long Pine Dr
- 7638 Long Pine Dr
- 5715 Heming Ave
- 5707 Heming Ave
Ask me questions while you tour the home.