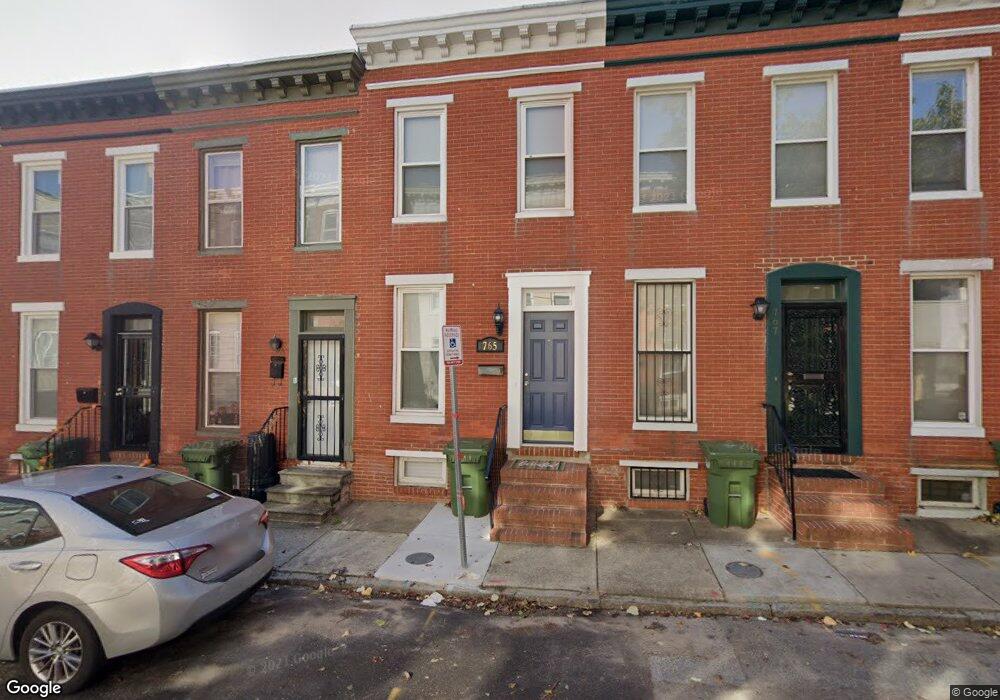
765 Carroll St Baltimore, MD 21230
Pigtown NeighborhoodEstimated Value: $168,000 - $172,141
About This Home
This home is located at 765 Carroll St, Baltimore, MD 21230 and is currently estimated at $170,071, approximately $191 per square foot. 765 Carroll St is a home located in Baltimore City with nearby schools including George Washington Elementary School, Booker T. Washington Middle School, and Digital Harbor High School.
Ownership History
We collect this data history from publicly available records. To have your information removed, we recommend requesting removal directly through your county’s website.
Purchase Details
Home Financials for this Owner
Home Financials are based on the most recent Mortgage that was taken out on this home.Purchase Details
Purchase Details
Purchase Details
Home Values in the Area
Average Home Value in this Area
Purchase History
We collect this data history from publicly available records. To have your information removed, we recommend requesting removal directly through your county’s website.
| Date | Buyer | Sale Price | Title Company |
|---|---|---|---|
| -- | -- | ||
| $27,500 | -- | ||
| $14,000 | -- | ||
| $59,000 | -- | ||
| $23,000 | -- | ||
| -- | -- |
Mortgage History
We collect this data history from publicly available records. To have your information removed, we recommend requesting removal directly through your county’s website.
| Date | Status | Borrower | Loan Amount |
|---|---|---|---|
| Open | $67,500 |
Tax History
We collect this data history from publicly available records. To have your information removed, we recommend requesting removal directly through your county’s website.
| Year | Tax Paid | Tax Assessment Tax Assessment Total Assessment is a certain percentage of the fair market value that is determined by local assessors to be the total taxable value of land and additions on the property. | Land | Improvement |
|---|---|---|---|---|
| 2025 | $3,226 | $146,233 | -- | -- |
| 2024 | $3,226 | $137,367 | -- | -- |
| 2023 | $3,018 | $128,500 | $60,000 | $68,500 |
| 2022 | $3,033 | $128,500 | $60,000 | $68,500 |
| 2021 | $3,033 | $128,500 | $60,000 | $68,500 |
| 2020 | $3,125 | $132,400 | $60,000 | $72,400 |
| 2019 | $3,039 | $129,367 | $0 | $0 |
| 2018 | $2,981 | $126,333 | $0 | $0 |
| 2017 | $2,910 | $123,300 | $0 | $0 |
| 2016 | $3,683 | $123,300 | $0 | $0 |
| 2015 | $3,683 | $123,300 | $0 | $0 |
| 2014 | $3,683 | $125,000 | $0 | $0 |
Map
- 835 Woodward St
- 837 Woodward St
- 833 Woodward St
- 839 Woodward St
- 831 Woodward St
- 841 Woodward St
- 829 Woodward St
- 843 Woodward St
- 827 Woodward St
- 845 Woodward St
- 825 Woodward St
- 830 Mangold St
- 832 Mangold St
- 828 Mangold St
- 847 Woodward St
- 834 Mangold St
- 823 Woodward St
- 826 Mangold St
- 824 Mangold St
- 836 Mangold St
Ask me questions while you tour the home.