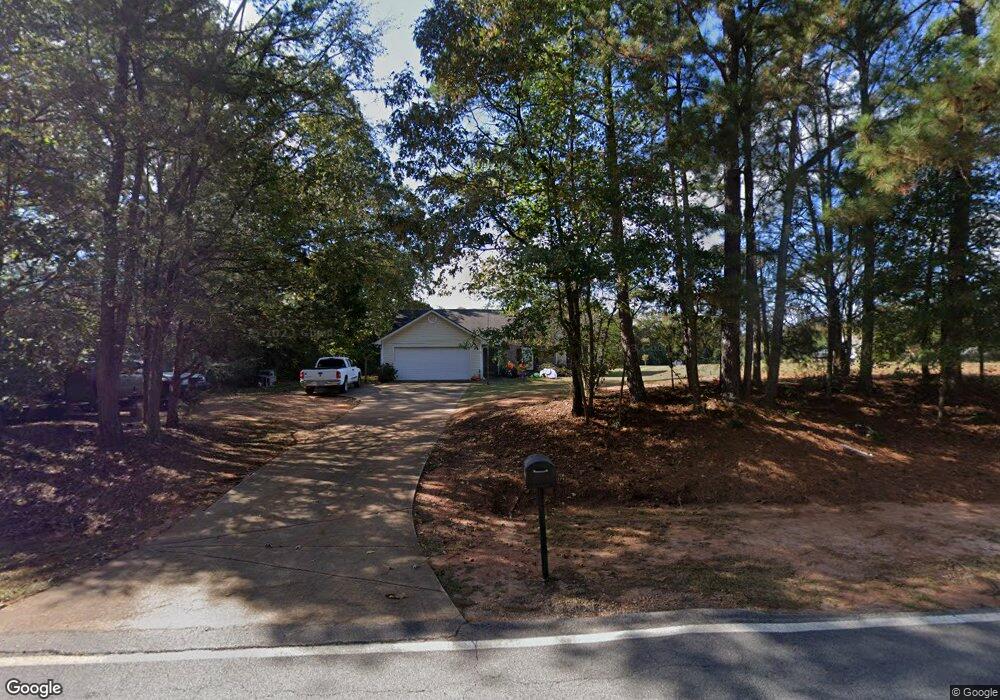
766 Pyne Rd Lagrange, GA 30240
Estimated Value: $225,000 - $231,000
3
Beds
2
Baths
1,400
Sq Ft
$163/Sq Ft
Est. Value
About This Home
This home is located at 766 Pyne Rd, Lagrange, GA 30240 and is currently estimated at $227,791, approximately $162 per square foot. 766 Pyne Rd is a home located in Troup County with nearby schools including Long Cane Elementary School, Berta Weathersbee Elementary School, and Whitesville Road Elementary School.
Ownership History
Date
Name
Owned For
Owner Type
Purchase Details
Closed on
Apr 29, 2021
Sold by
Messer Investment Properties Inc
Bought by
Richter John Lee and Richter Kelsea
Current Estimated Value
Home Financials for this Owner
Home Financials are based on the most recent Mortgage that was taken out on this home.
Original Mortgage
$140,000
Interest Rate
3.1%
Mortgage Type
New Conventional
Purchase Details
Closed on
Oct 17, 2019
Sold by
Anna Cole Real Properties Llc
Bought by
Messer Investment Properties Inc
Purchase Details
Closed on
Mar 11, 2003
Sold by
Travis Cassell
Bought by
Anna Cole Real Properties Llc
Purchase Details
Closed on
Aug 16, 2002
Sold by
Jerry Ballard Homes
Bought by
Travis Cassell
Purchase Details
Closed on
Oct 26, 2001
Sold by
General Warranty Services
Bought by
Jerry Ballard Homes
Purchase Details
Closed on
Apr 23, 2001
Sold by
Whitaker Family Devel
Bought by
General Warranty Services
Create a Home Valuation Report for This Property
The Home Valuation Report is an in-depth analysis detailing your home's value as well as a comparison with similar homes in the area
Purchase History
| Date | Buyer | Sale Price | Title Company |
|---|---|---|---|
| Richter John Lee | $150,000 | -- | |
| Messer Investment Properties Inc | $118,000 | -- | |
| Anna Cole Real Properties Llc | -- | -- | |
| Travis Cassell | $105,900 | -- | |
| Jerry Ballard Homes | $111,000 | -- | |
| General Warranty Services | -- | -- |
Source: Public Records
Mortgage History
| Date | Status | Borrower | Loan Amount |
|---|---|---|---|
| Closed | Richter John Lee | $140,000 |
Source: Public Records
Tax History
| Year | Tax Paid | Tax Assessment Tax Assessment Total Assessment is a certain percentage of the fair market value that is determined by local assessors to be the total taxable value of land and additions on the property. | Land | Improvement |
|---|---|---|---|---|
| 2025 | $2,031 | $74,456 | $14,000 | $60,456 |
| 2024 | $2,000 | $73,348 | $14,000 | $59,348 |
| 2023 | $1,884 | $69,072 | $10,000 | $59,072 |
| 2022 | $1,640 | $58,752 | $8,000 | $50,752 |
| 2021 | $1,636 | $54,228 | $8,000 | $46,228 |
| 2020 | $1,424 | $54,228 | $8,000 | $46,228 |
| 2019 | $1,561 | $51,760 | $6,000 | $45,760 |
| 2018 | $1,434 | $47,564 | $6,000 | $41,564 |
| 2017 | $1,435 | $47,564 | $6,000 | $41,564 |
| 2016 | $1,115 | $36,982 | $3,600 | $33,382 |
| 2015 | $1,117 | $36,982 | $3,600 | $33,382 |
| 2014 | $980 | $32,376 | $3,600 | $28,776 |
| 2013 | -- | $34,248 | $3,600 | $30,648 |
Source: Public Records
Map
Nearby Homes
- 6 Hastings Ct
- 113 Colonial Ct
- 311 Cumberland Dr
- 101 Ivy Springs Dr
- 104 Independence Ct
- 300 Cumberland Dr
- 474 Newton Rd
- 16 River Point Dr
- 40 River Point Dr
- 20 Hill Rd
- 36 Hill Rd
- 3658 W Point Rd
- 245 Teaver Rd
- 129 Angela East Dr
- 4.51 ACRES Whatley Rd N
- 0 Deming St Unit 10550189
- 0 Glass Bridge Rd Unit 10679358
- 851 Vernon Ferry Rd
- 98 Hearn Rd
- 213 Linda Ln
- 780 Pyne Rd
- 9 Savannah Place Dr
- 3 Hastings Ct
- 11 Savannah Place Dr
- 798 Pyne Rd
- 10 Savannah Place Dr
- 1 Hastings Ct
- 12 Savannah Place Dr
- 4 Hastings Ct
- 2 Hastings Ct
- 14 Savannah Place Dr
- 824 Pyne Rd
- 696 Pyne Rd
- 16 Savannah Place Dr
- 23 Newton Rd
- 5 Carnegie Ct
- 17 Savannah Place Dr
- 18 Savannah Place Dr
- 3 Carnegie Ct
- 37 Newton Rd
Your Personal Tour Guide
Ask me questions while you tour the home.