Estimated Value: $36,000 - $164,000
4
Beds
7
Baths
2,080
Sq Ft
$41/Sq Ft
Est. Value
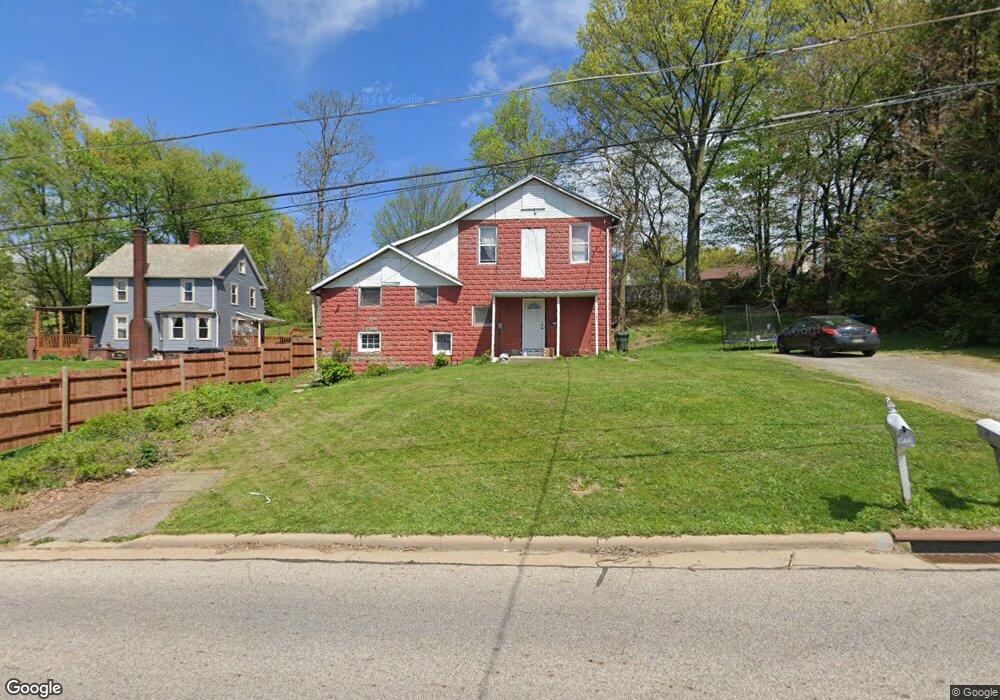
About This Home
This home is located at 766 Southeast Blvd, Salem, OH 44460 and is currently estimated at $84,525, approximately $40 per square foot. 766 Southeast Blvd is a home located in Columbiana County with nearby schools including Reilly Elementary School, Buckeye Elementary School, and Southeast Elementary School.
Ownership History
Date
Name
Owned For
Owner Type
Purchase Details
Closed on
Dec 19, 2025
Sold by
Kendrew Joseph B
Bought by
Wood Ashley
Current Estimated Value
Purchase Details
Closed on
Jul 10, 2023
Sold by
Reynolds Brenda
Bought by
Kendrew Joseph
Purchase Details
Closed on
Dec 30, 2005
Sold by
Warfel David T and Case #2004-Cv-801926
Bought by
Abn Amro Mortgage Group Inc
Purchase Details
Closed on
Aug 6, 1999
Sold by
Bonam Brian A and Bonam Judy L
Bought by
Warfel David T
Home Financials for this Owner
Home Financials are based on the most recent Mortgage that was taken out on this home.
Original Mortgage
$52,000
Interest Rate
9.75%
Purchase Details
Closed on
Jul 20, 1993
Bought by
Bonam Brian A and Or Judy L
Create a Home Valuation Report for This Property
The Home Valuation Report is an in-depth analysis detailing your home's value as well as a comparison with similar homes in the area
Home Values in the Area
Average Home Value in this Area
Purchase History
| Date | Buyer | Sale Price | Title Company |
|---|---|---|---|
| Wood Ashley | $36,000 | None Listed On Document | |
| Kendrew Joseph | -- | None Listed On Document | |
| Abn Amro Mortgage Group Inc | $23,000 | None Available | |
| Warfel David T | $65,000 | Heritage Title | |
| Bonam Brian A | $35,000 | -- |
Source: Public Records
Mortgage History
| Date | Status | Borrower | Loan Amount |
|---|---|---|---|
| Previous Owner | Warfel David T | $52,000 | |
| Closed | Warfel David T | $13,000 |
Source: Public Records
Tax History
| Year | Tax Paid | Tax Assessment Tax Assessment Total Assessment is a certain percentage of the fair market value that is determined by local assessors to be the total taxable value of land and additions on the property. | Land | Improvement |
|---|---|---|---|---|
| 2025 | $1,165 | $27,940 | $7,950 | $19,990 |
| 2024 | $1,029 | $23,280 | $6,620 | $16,660 |
| 2023 | $1,032 | $23,280 | $6,620 | $16,660 |
| 2022 | $964 | $23,280 | $6,620 | $16,660 |
| 2021 | $841 | $19,040 | $6,650 | $12,390 |
| 2020 | $848 | $19,040 | $6,650 | $12,390 |
| 2019 | $848 | $19,040 | $6,650 | $12,390 |
| 2018 | $807 | $17,330 | $6,060 | $11,270 |
| 2017 | $992 | $17,330 | $6,060 | $11,270 |
| 2016 | $801 | $11,380 | $9,280 | $2,100 |
| 2015 | $523 | $11,380 | $9,280 | $2,100 |
| 2014 | $517 | $11,380 | $9,280 | $2,100 |
Source: Public Records
Map
Nearby Homes
- 1000 Southeast Blvd
- 1175 S Lincoln Ave
- 615 Deming St
- 884 Summit St
- 1363 Southeast Blvd
- 652 E Euclid Ave
- 1026 Franklin Ave
- 921 Homewood Ave
- 875 Homewood Ave
- 559 E Perry St
- 861 S Lincoln Ave
- 854 S Lincoln Ave
- 1852 Fairview Ct
- 930 Canterbury Ln Unit A
- 427 S Union Ave
- 1759 Depot Rd
- 1319 Pembrooke Dr Unit C
- 845 Adams Ave
- 339 S Union Ave
- 520 Walnut St
- 1480 S Lincoln Ave
- 808 Southeast Blvd
- 1516 S Lincoln Ave
- 816 Southeast Blvd
- 1539 S Lincoln Ave
- 1461 S Lincoln Ave
- 828 Southeast Blvd
- 815 Southeast Blvd
- 1519 S Lincoln Ave
- 803 Southeast Blvd
- 1411 S Lincoln Ave Unit B
- 1411 S Lincoln Ave Unit A
- 685 Olive St
- 842 Southeast Blvd
- 1361 S Lincoln Ave Unit 1
- 1361 S Lincoln Ave Unit B
- 1361 S Lincoln Ave Unit A
- 1361 S Lincoln Ave Unit A/B A/B
- 1445 S Lincoln Ave
- 1615 S Lincoln Ave
Your Personal Tour Guide
Ask me questions while you tour the home.