7670 SE 41st Ct Ocala, FL 34480
Silver Spring Shores NeighborhoodEstimated Value: $206,000 - $299,000
About This Home
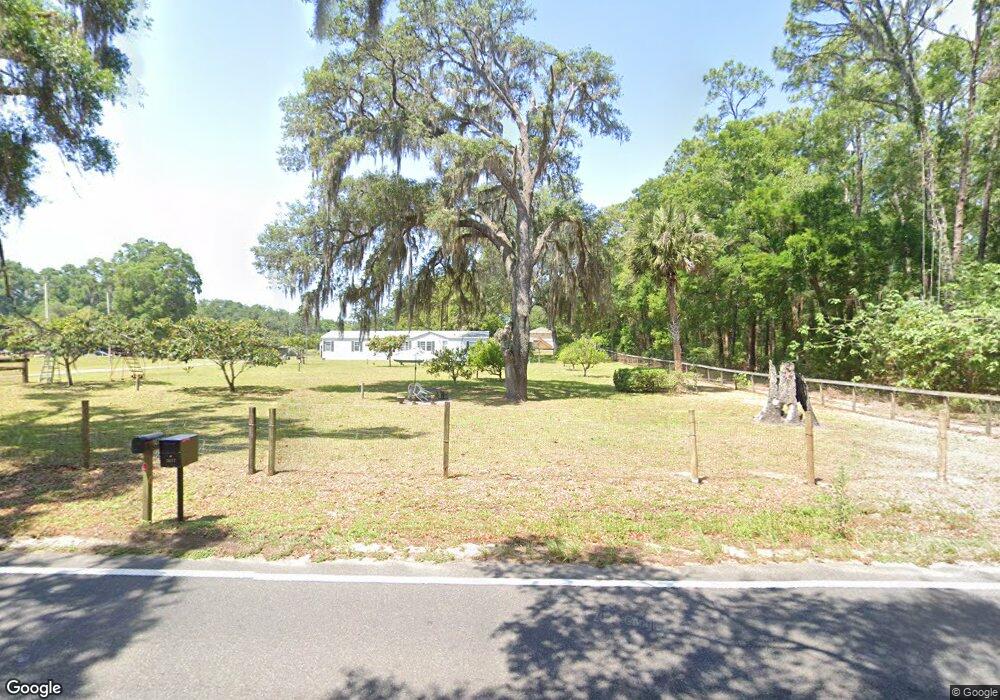
This home is located at 7670 SE 41st Ct, Ocala, FL 34480 and is currently estimated at $232,456, approximately $128 per square foot. 7670 SE 41st Ct is a home located in Marion County with nearby schools including Shady Hill Elementary School, Belleview Middle School, and Belleview High School.
Ownership History
We collect this data history from publicly available records. To have your information removed, we recommend requesting removal directly through your county’s website.
Purchase Details
Home Financials for this Owner
Home Financials are based on the most recent Mortgage that was taken out on this home.Purchase Details
Home Financials for this Owner
Home Financials are based on the most recent Mortgage that was taken out on this home.Purchase Details
Home Values in the Area
Average Home Value in this Area
Purchase History
We collect this data history from publicly available records. To have your information removed, we recommend requesting removal directly through your county’s website.
| Date | Buyer | Sale Price | Title Company |
|---|---|---|---|
| $175,000 | First American Title Insurance | ||
| -- | None Available | ||
| -- | Affiliated Title Of Marion C |
Mortgage History
We collect this data history from publicly available records. To have your information removed, we recommend requesting removal directly through your county’s website.
| Date | Status | Borrower | Loan Amount |
|---|---|---|---|
| Open | $315,000 | ||
| Closed | $145,000 | ||
| Previous Owner | $75,000 | ||
| Previous Owner | $85,000 | ||
| Previous Owner | $21,600 | ||
| Previous Owner | $75,000 |
Tax History
We collect this data history from publicly available records. To have your information removed, we recommend requesting removal directly through your county’s website.
| Year | Tax Paid | Tax Assessment Tax Assessment Total Assessment is a certain percentage of the fair market value that is determined by local assessors to be the total taxable value of land and additions on the property. | Land | Improvement |
|---|---|---|---|---|
| 2025 | $4,236 | $209,999 | $39,950 | $170,049 |
| 2024 | $4,243 | $233,906 | $25,568 | $208,338 |
| 2023 | $4,243 | $142,632 | ||
| 2022 | $3,063 | $129,665 | $0 | $0 |
| 2021 | $2,519 | $117,877 | $13,583 | $104,294 |
| 2020 | $2,447 | $112,610 | $11,186 | $101,424 |
| 2019 | $2,448 | $111,479 | $11,186 | $100,293 |
| 2018 | $2,310 | $107,941 | $11,186 | $96,755 |
| 2017 | $1,476 | $94,085 | $0 | $0 |
| 2016 | $1,420 | $92,150 | $0 | $0 |
| 2015 | $1,415 | $91,509 | $0 | $0 |
| 2014 | $1,346 | $90,783 | $0 | $0 |
Map
- 147 Juniper Cir
- 7575 S US Hwy 441 All Units Unit 48
- 8 Juniper Loop Dr
- 3703 SE 67th Place
- 24 Juniper Dr
- 133 Larch Rd
- 176 Juniper Loop Cir
- 0 U S 301
- 4170 SE 65th Place
- 251 Chestnut Rd
- 6480 SE 42nd Ct
- 0 Juniper Rd Unit MFRS5136963
- 0 Juniper Loop Cir Unit MFROM692865
- 114 Juniper Loop Cir
- 3980 SE 84th Lane Rd
- 135 Juniper Loop
- 6895A Holyoke Ct Unit 30
- 1701 W B Gleneagles Unit 224
- 7201 B Merion Place Unit 853
- 212 C East Gleneagles Rd Unit 572
- 7800 SE 41st Ct
- 7770 SE 41st Ct
- 7900 SE 41st Ct
- 7885 SE 41st Ct
- 3931 SE 80th St
- 3931 SE 80th St
- 3899 SE 80th St
- 3985 SE 80th St
- 3995 SE 80th St
- 4041 SE 80th St
- 7639 SE 36th Ave
- 4001 SE 80th St
- 3861 SE 80th St
- 4206 SE 79th St
- 4242 SE 79th St
- 3841 SE 80th St
- 7617 SE 36th Ave
- 3990 SE 80th St
- 4259 SE 79th St
- 3920 SE 80th St
Ask me questions while you tour the home.