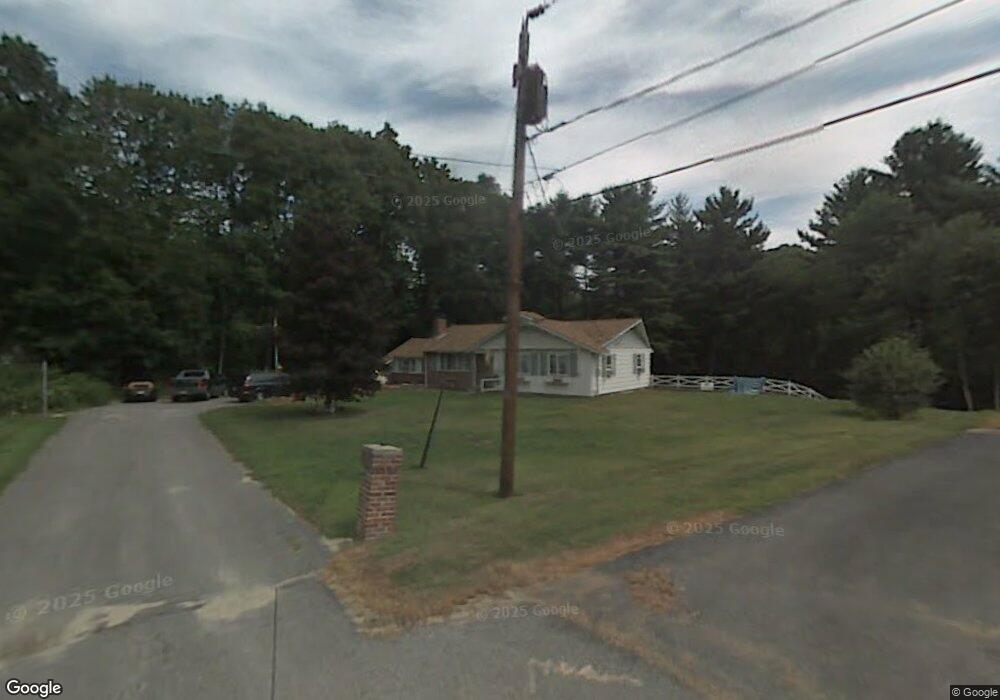
77 Connor Ln Lancaster, MA 01523
Estimated Value: $653,000 - $803,000
3
Beds
3
Baths
2,400
Sq Ft
$293/Sq Ft
Est. Value
About This Home
This home is located at 77 Connor Ln, Lancaster, MA 01523 and is currently estimated at $703,299, approximately $293 per square foot. 77 Connor Ln is a home located in Worcester County with nearby schools including Mary Rowlandson Elementary School, Luther Burbank Middle School, and Nashoba Regional High School.
Ownership History
Date
Name
Owned For
Owner Type
Purchase Details
Closed on
Oct 17, 2003
Sold by
Campbell Barbara L
Bought by
Campbell Nt and Cheever Charles A
Current Estimated Value
Purchase Details
Closed on
Jun 19, 2003
Sold by
Ryan Karen E and Ryan Walter T
Bought by
Campbell Barbara L
Home Financials for this Owner
Home Financials are based on the most recent Mortgage that was taken out on this home.
Original Mortgage
$288,000
Interest Rate
5.71%
Mortgage Type
Purchase Money Mortgage
Create a Home Valuation Report for This Property
The Home Valuation Report is an in-depth analysis detailing your home's value as well as a comparison with similar homes in the area
Home Values in the Area
Average Home Value in this Area
Purchase History
| Date | Buyer | Sale Price | Title Company |
|---|---|---|---|
| Campbell Nt | -- | -- | |
| Campbell Barbara L | $360,000 | -- |
Source: Public Records
Mortgage History
| Date | Status | Borrower | Loan Amount |
|---|---|---|---|
| Previous Owner | Campbell Barbara L | $288,000 |
Source: Public Records
Tax History
| Year | Tax Paid | Tax Assessment Tax Assessment Total Assessment is a certain percentage of the fair market value that is determined by local assessors to be the total taxable value of land and additions on the property. | Land | Improvement |
|---|---|---|---|---|
| 2025 | $9,360 | $579,200 | $122,400 | $456,800 |
| 2024 | $10,081 | $577,400 | $113,900 | $463,500 |
| 2023 | $8,951 | $520,700 | $103,600 | $417,100 |
| 2022 | $8,877 | $456,400 | $105,700 | $350,700 |
| 2021 | $8,258 | $413,300 | $105,700 | $307,600 |
| 2020 | $8,569 | $431,700 | $105,700 | $326,000 |
| 2019 | $7,695 | $389,600 | $105,700 | $283,900 |
| 2018 | $7,409 | $370,800 | $105,700 | $265,100 |
| 2016 | $6,946 | $355,300 | $104,700 | $250,600 |
| 2015 | $6,626 | $353,200 | $104,700 | $248,500 |
| 2014 | $6,288 | $332,500 | $104,700 | $227,800 |
Source: Public Records
Map
Nearby Homes
- 30 S Meadow Rd
- 0 Parker Rd
- 200 Greeley St
- 861 Main St
- 29 Bennett Ln
- 719 Main St
- 132 Kilbourn Rd
- 508 High St
- 57 Clark St
- 55 Sterling St Unit 306
- 55 Sterling St Unit 314
- 55 Sterling St Unit 103
- 55 Sterling St Unit 208
- 55 Sterling St Unit 305
- 9 Hamilton St
- 7-9 Boynton St
- 329 Mill St
- 12 Cole Farm Rd
- 19 Brendan Rd
- 256 Bolton Rd
Your Personal Tour Guide
Ask me questions while you tour the home.