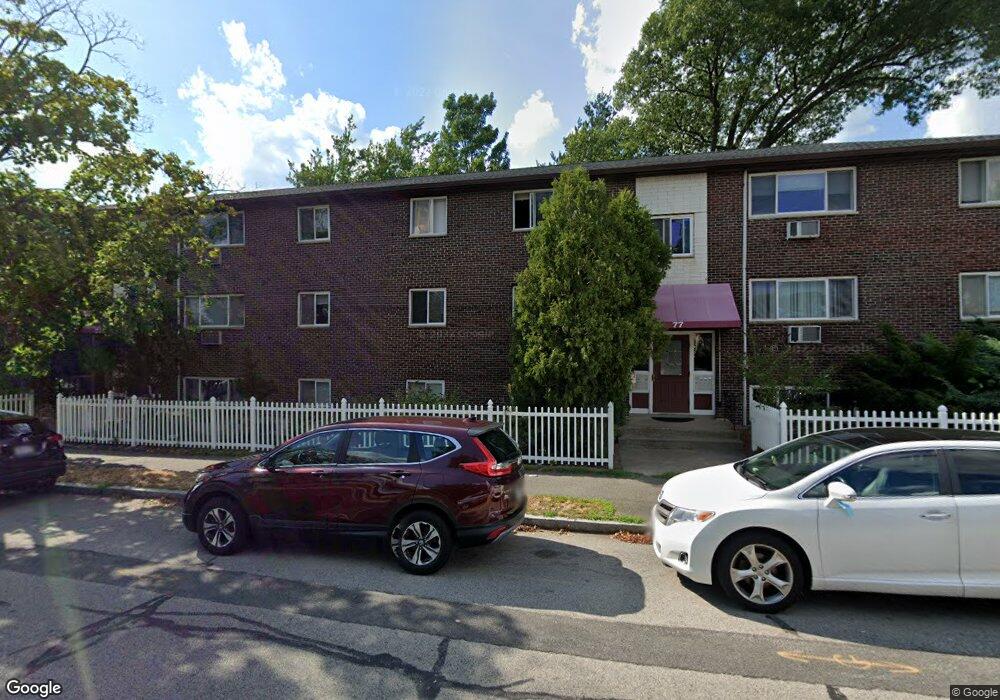
77 Holbrook Rd Unit 2 Quincy, MA 02171
Montclair NeighborhoodEstimated Value: $333,841 - $372,000
2
Beds
1
Bath
627
Sq Ft
$578/Sq Ft
Est. Value
About This Home
This home is located at 77 Holbrook Rd Unit 2, Quincy, MA 02171 and is currently estimated at $362,210, approximately $577 per square foot. 77 Holbrook Rd Unit 2 is a home located in Norfolk County with nearby schools including Montclair Elementary School, Atlantic Middle School, and North Quincy High School.
Ownership History
Date
Name
Owned For
Owner Type
Purchase Details
Closed on
Nov 28, 2023
Sold by
Lee Tat S and Wan Sau K
Bought by
Lee Tat S and Lee Chun K
Current Estimated Value
Purchase Details
Closed on
Feb 28, 2012
Sold by
Lee Tat S
Bought by
Lee Tat S and Wan Sau K
Purchase Details
Closed on
Jul 16, 2010
Sold by
Silverman Jason and Wells Fargo Bk
Bought by
Federal National Mortgage Association
Create a Home Valuation Report for This Property
The Home Valuation Report is an in-depth analysis detailing your home's value as well as a comparison with similar homes in the area
Home Values in the Area
Average Home Value in this Area
Purchase History
| Date | Buyer | Sale Price | Title Company |
|---|---|---|---|
| Lee Tat S | -- | None Available | |
| Lee Tat S | -- | -- | |
| Federal National Mortgage Association | $121,766 | -- |
Source: Public Records
Tax History
| Year | Tax Paid | Tax Assessment Tax Assessment Total Assessment is a certain percentage of the fair market value that is determined by local assessors to be the total taxable value of land and additions on the property. | Land | Improvement |
|---|---|---|---|---|
| 2025 | $3,575 | $310,100 | $0 | $310,100 |
| 2024 | $3,269 | $290,100 | $0 | $290,100 |
| 2023 | $2,913 | $261,700 | $0 | $261,700 |
| 2022 | $3,386 | $282,600 | $0 | $282,600 |
| 2021 | $3,301 | $271,900 | $0 | $271,900 |
| 2020 | $3,315 | $266,700 | $0 | $266,700 |
| 2019 | $2,613 | $208,200 | $0 | $208,200 |
| 2018 | $2,579 | $193,300 | $0 | $193,300 |
| 2017 | $2,595 | $183,100 | $0 | $183,100 |
| 2016 | $2,466 | $171,700 | $0 | $171,700 |
| 2015 | $2,504 | $171,500 | $0 | $171,500 |
| 2014 | $2,333 | $157,000 | $0 | $157,000 |
Source: Public Records
Map
Nearby Homes
- 54 Safford St
- 98 Safford St
- 115 W Squantum St Unit 816
- 115 W Squantum St Unit 517
- 115 W Squantum St Unit 203
- 115 W Squantum St Unit 811
- 17 Holmes St Unit 2
- 138 Sherman St
- 134 Sherman St
- 267-269 Farrington St
- 85 E Squantum St Unit 10
- 20 Ellington Rd
- 85 Hilma St
- 4 Edwin St
- 151 Hancock St Unit 7
- 30 Elmwood Park
- 150 Hancock St Unit 101
- 85 Myrtle St Unit 110
- 85 Myrtle St Unit 106
- 70 Walnut St
- 77 Holbrook Rd Unit 6
- 77 Holbrook Rd Unit 5
- 77 Holbrook Rd Unit 4
- 77 Holbrook Rd Unit 3
- 77 Holbrook Rd Unit 1
- 31 Safford St Unit 4
- 31 Safford St Unit 3
- 63 Holbrook Rd
- 41 Safford St Unit 49
- 79 Holbrook Rd Unit 6
- 79 Holbrook Rd Unit 5
- 79 Holbrook Rd Unit 4
- 79 Holbrook Rd Unit 3
- 79 Holbrook Rd Unit 1
- 79 Holbrook Rd Unit 2
- 74 Holbrook Rd Unit 74
- 56 Holbrook Rd Unit 1
- 56 Holbrook Rd
- 47 Safford St
- 49 Safford St
Your Personal Tour Guide
Ask me questions while you tour the home.