77 Maple St Milford, CT 06460
Downtown Milford NeighborhoodEstimated Value: $694,570 - $800,000
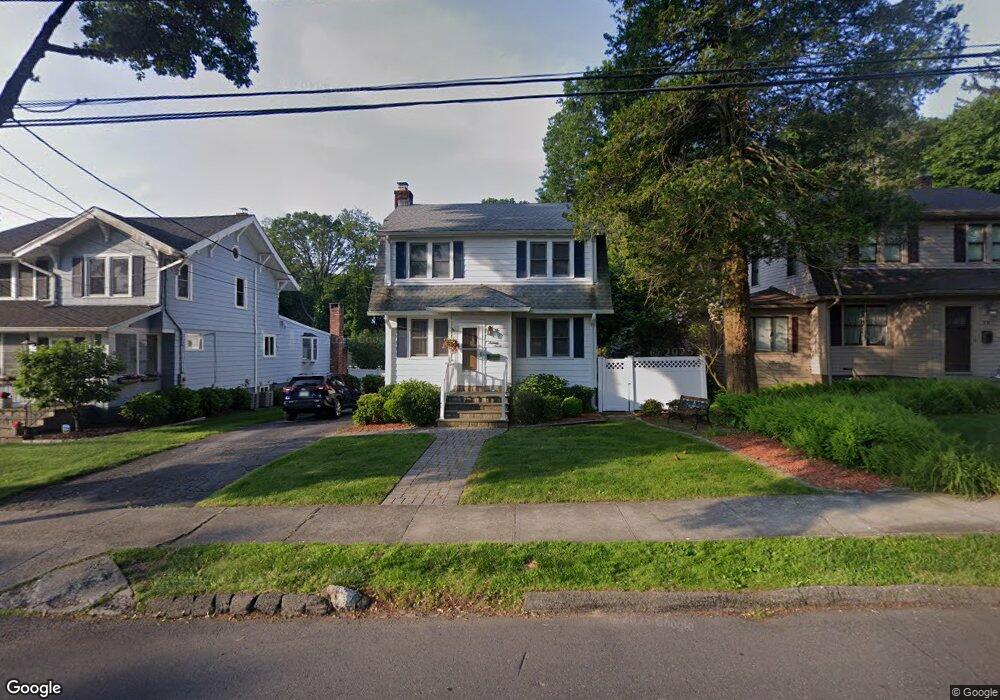
About This Home
This home is located at 77 Maple St, Milford, CT 06460 and is currently estimated at $742,893, approximately $338 per square foot. 77 Maple St is a home located in New Haven County with nearby schools including Orange Avenue School, Harborside Middle School, and Joseph A. Foran High School.
Ownership History
We collect this data history from publicly available records. To have your information removed, we recommend requesting removal directly through your county’s website.
Purchase Details
Home Values in the Area
Average Home Value in this Area
Purchase History
We collect this data history from publicly available records. To have your information removed, we recommend requesting removal directly through your county’s website.
| Date | Buyer | Sale Price | Title Company |
|---|---|---|---|
| -- | -- |
Tax History
We collect this data history from publicly available records. To have your information removed, we recommend requesting removal directly through your county’s website.
| Year | Tax Paid | Tax Assessment Tax Assessment Total Assessment is a certain percentage of the fair market value that is determined by local assessors to be the total taxable value of land and additions on the property. | Land | Improvement |
|---|---|---|---|---|
| 2025 | $9,441 | $319,500 | $122,970 | $196,530 |
| 2024 | $9,310 | $319,500 | $122,970 | $196,530 |
| 2023 | $8,681 | $319,500 | $122,970 | $196,530 |
| 2022 | $8,515 | $319,500 | $122,970 | $196,530 |
| 2021 | $7,306 | $264,240 | $90,240 | $174,000 |
| 2020 | $7,314 | $264,240 | $90,240 | $174,000 |
| 2019 | $7,322 | $264,240 | $90,240 | $174,000 |
| 2018 | $7,330 | $264,240 | $90,240 | $174,000 |
| 2017 | $7,343 | $264,240 | $90,240 | $174,000 |
| 2016 | $7,096 | $254,890 | $89,960 | $164,930 |
| 2015 | $7,106 | $254,890 | $89,960 | $164,930 |
| 2014 | $6,938 | $254,890 | $89,960 | $164,930 |
Map
- 46 Maple St
- 152 W River St
- 231 W River St
- 97 North St
- 154 North St
- 146 High St Unit 201
- 8 Hattie Ln
- 316 W Main St
- 83 Tower St
- 69 Sunnyside Ct
- 36 Shipyard Ln Unit C
- 157 Clark St
- 16 John Henry Ln
- 19 Covington Dr
- 6 Harborside Dr
- 44 Randolph Farm Rd
- 23 Randolph Farm Rd
- 63 Golden Hill St
- 131 Oronoque Rd
- 15 Corona Dr
Ask me questions while you tour the home.