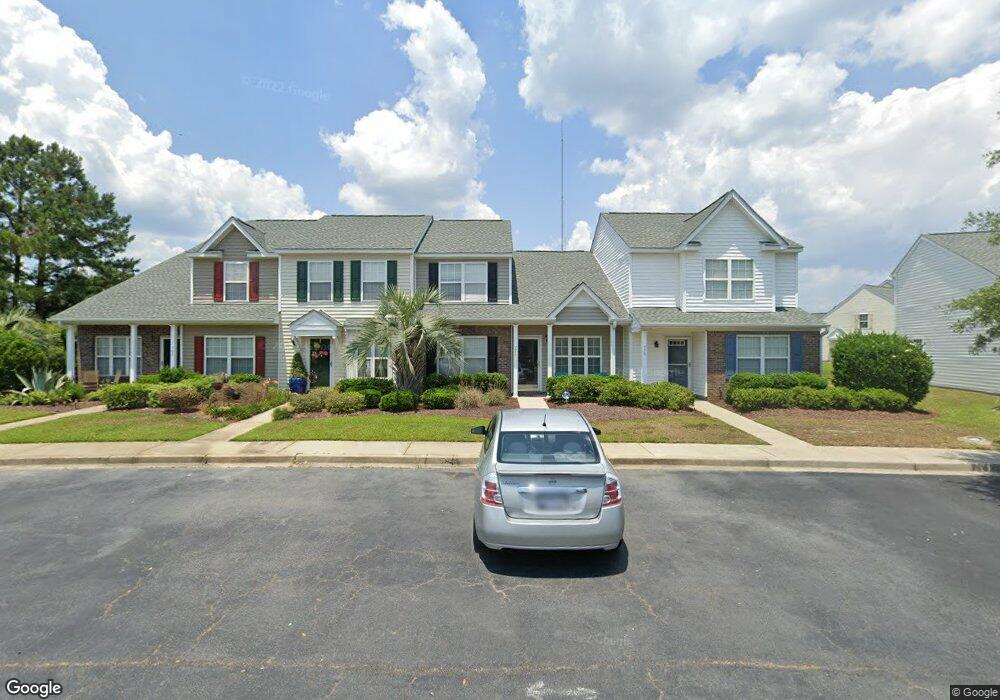
771 Wilshire Ln Murrells Inlet, SC 29576
Burgess NeighborhoodEstimated Value: $229,291 - $247,000
3
Beds
3
Baths
1,500
Sq Ft
$159/Sq Ft
Est. Value
About This Home
This home is located at 771 Wilshire Ln, Murrells Inlet, SC 29576 and is currently estimated at $238,323, approximately $158 per square foot. 771 Wilshire Ln is a home located in Horry County with nearby schools including St. James Elementary School, St. James Intermediate, and St. James High School.
Ownership History
Date
Name
Owned For
Owner Type
Purchase Details
Closed on
Feb 7, 2011
Sold by
Federal National Mortgage Association
Bought by
Best Natasha D
Current Estimated Value
Purchase Details
Closed on
Sep 26, 2005
Sold by
Hartman Melissa F
Bought by
Grose David and Grose Jillian
Home Financials for this Owner
Home Financials are based on the most recent Mortgage that was taken out on this home.
Original Mortgage
$137,750
Interest Rate
2%
Mortgage Type
Fannie Mae Freddie Mac
Purchase Details
Closed on
Mar 31, 2005
Sold by
Wible Norman M
Bought by
Hartman Melissa F
Home Financials for this Owner
Home Financials are based on the most recent Mortgage that was taken out on this home.
Original Mortgage
$114,000
Interest Rate
6.25%
Mortgage Type
Unknown
Purchase Details
Closed on
Mar 28, 2002
Sold by
Portrait Homes Myrtle Beach Llc
Bought by
Wible Norman M
Home Financials for this Owner
Home Financials are based on the most recent Mortgage that was taken out on this home.
Original Mortgage
$115,350
Interest Rate
6.8%
Mortgage Type
FHA
Create a Home Valuation Report for This Property
The Home Valuation Report is an in-depth analysis detailing your home's value as well as a comparison with similar homes in the area
Home Values in the Area
Average Home Value in this Area
Purchase History
| Date | Buyer | Sale Price | Title Company |
|---|---|---|---|
| Best Natasha D | -- | -- | |
| Grose David | $145,000 | -- | |
| Hartman Melissa F | $120,000 | -- | |
| Wible Norman M | $117,210 | -- |
Source: Public Records
Mortgage History
| Date | Status | Borrower | Loan Amount |
|---|---|---|---|
| Previous Owner | Grose David | $137,750 | |
| Previous Owner | Hartman Melissa F | $114,000 | |
| Previous Owner | Wible Norman M | $115,350 |
Source: Public Records
Tax History
| Year | Tax Paid | Tax Assessment Tax Assessment Total Assessment is a certain percentage of the fair market value that is determined by local assessors to be the total taxable value of land and additions on the property. | Land | Improvement |
|---|---|---|---|---|
| 2025 | $668 | $0 | $0 | $0 |
| 2024 | $668 | $8,113 | $2,760 | $5,353 |
| 2023 | $668 | $5,120 | $1,120 | $4,000 |
| 2021 | $529 | $5,120 | $1,120 | $4,000 |
| 2020 | $456 | $5,120 | $1,120 | $4,000 |
| 2019 | $456 | $5,120 | $1,120 | $4,000 |
| 2018 | $441 | $4,812 | $920 | $3,892 |
| 2017 | $426 | $4,812 | $920 | $3,892 |
| 2016 | -- | $4,812 | $920 | $3,892 |
| 2015 | $426 | $4,812 | $920 | $3,892 |
| 2014 | $372 | $4,812 | $920 | $3,892 |
Source: Public Records
Map
Nearby Homes
- 772 Wilshire Ln
- 764 Wilshire Ln
- 795 Wilshire Ln
- 420 Whinstone Dr
- 816 Wilshire Ln
- 956 Williston Loop
- 931 Williston Loop
- 693 Wilshire Ln
- 106 Wimbledon Way Unit 106
- 326 Wembley Way Unit 326
- 353 Green Creek Bay Cir
- 266 Laurel Bay Dr
- 361 Green Creek Bay Cir
- 145 Wimbledon Way
- 420 Warrington Way Unit 420
- 144 Wimbledon Way
- 168 Wimbledon Way
- 119 Chenoa Dr Unit 4D
- 131 Chenoa Dr Unit D
- 107 Chenoa Dr Unit A
- 775 Wilshire Ln Unit 40
- 767 Wilshire Ln
- 763 Wilshire Ln
- 783 Wilshire Ln
- 787 Wilshire Ln
- 757 Wilshire Ln
- 791 Wilshire Ln Unit Wynbrook Townhomes
- 791 Wilshire Ln
- 791 Wilshire Ln Unit 791
- 753 Wilshire Ln
- 756 Wilshire Ln
- 756 Wilshire Ln
- 749 Wilshire Ln
- 750 Wilshire Ln
- 745 Wilshire Ln
- 943 Williston Loop
- 741 Wilshire Ln
- 799 Wilshire Ln
- 742 Wilshire Ln
- 960 Williston Loop
Your Personal Tour Guide
Ask me questions while you tour the home.