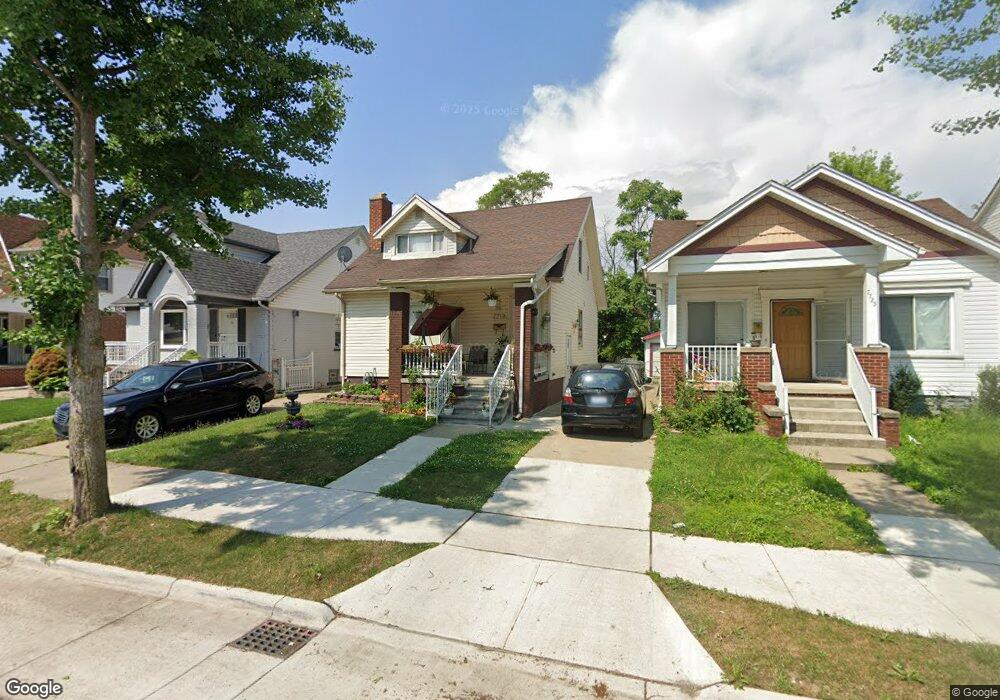
7719 Mead St Dearborn, MI 48126
Oakman Grove NeighborhoodEstimated Value: $199,770 - $236,000
4
Beds
3
Baths
1,170
Sq Ft
$187/Sq Ft
Est. Value
About This Home
This home is located at 7719 Mead St, Dearborn, MI 48126 and is currently estimated at $219,193, approximately $187 per square foot. 7719 Mead St is a home located in Wayne County with nearby schools including Oakman Elementary School, McCollough-Unis School, and Dearborn High School.
Ownership History
Date
Name
Owned For
Owner Type
Purchase Details
Closed on
Oct 28, 2024
Sold by
Hamid Janan Mohamed
Bought by
Hamid Janan Mohamed and Aljebory Mohammed
Current Estimated Value
Purchase Details
Closed on
Dec 11, 2019
Sold by
Aljebory Mohsin R
Bought by
Hamid Janan Mohamed
Purchase Details
Closed on
Oct 7, 2003
Sold by
Hud
Bought by
Aljebory Mohsin
Purchase Details
Closed on
Feb 21, 2003
Sold by
Washtenaw Mortgage Co
Bought by
Hud
Purchase Details
Closed on
May 9, 2002
Sold by
Karram Karram
Bought by
Washtenaw Mtg Co
Purchase Details
Closed on
Mar 15, 2001
Sold by
Gharib Jawad
Bought by
Samhat Ali A
Create a Home Valuation Report for This Property
The Home Valuation Report is an in-depth analysis detailing your home's value as well as a comparison with similar homes in the area
Home Values in the Area
Average Home Value in this Area
Purchase History
We collect this data history from publicly available records. To have your information removed, we recommend requesting removal directly through your county’s website.
| Date | Buyer | Sale Price | Title Company |
|---|---|---|---|
| Hamid Janan Mohamed | -- | None Listed On Document | |
| Hamid Janan Mohamed | -- | None Available | |
| Aljebory Mohsin | $93,800 | Multiple | |
| Hud | -- | Commonwealth Land Title | |
| Washtenaw Mtg Co | $150,731 | -- | |
| Samhat Ali A | $37,500 | -- |
Source: Public Records
Tax History
| Year | Tax Paid | Tax Assessment Tax Assessment Total Assessment is a certain percentage of the fair market value that is determined by local assessors to be the total taxable value of land and additions on the property. | Land | Improvement |
|---|---|---|---|---|
| 2025 | $1,775 | $86,900 | $0 | $0 |
| 2024 | $1,736 | $77,900 | $0 | $0 |
| 2023 | $1,643 | $69,700 | $0 | $0 |
| 2022 | $1,849 | $56,100 | $0 | $0 |
| 2021 | $2,148 | $52,800 | $0 | $0 |
| 2019 | $2,126 | $46,800 | $0 | $0 |
| 2018 | $1,801 | $40,700 | $0 | $0 |
| 2017 | $517 | $37,200 | $0 | $0 |
| 2016 | $1,685 | $35,000 | $0 | $0 |
| 2015 | $3,184 | $35,000 | $0 | $0 |
| 2013 | $3,085 | $30,850 | $0 | $0 |
| 2011 | -- | $33,900 | $0 | $0 |
Source: Public Records
Map
Nearby Homes
- 7800 Mead St
- 7800 Coleman St
- 15100 Tireman St
- 7309 Payne Ave
- 8090 Robson St
- 7309 Ternes
- 7239 Barrie St
- 7308 Orchard Ave
- 7444 Kendal St
- 7308 Winthrop St
- 8227 Coyle St
- 7285 Winthrop St
- 8260 Coyle St
- 8232 Marlowe St
- 8235 Prest St
- 8304 Robson St
- 7410 Barrie St
- 14433 W Warren Ave
- 7282 Forrer St
- 8311 Marlowe St
Your Personal Tour Guide
Ask me questions while you tour the home.