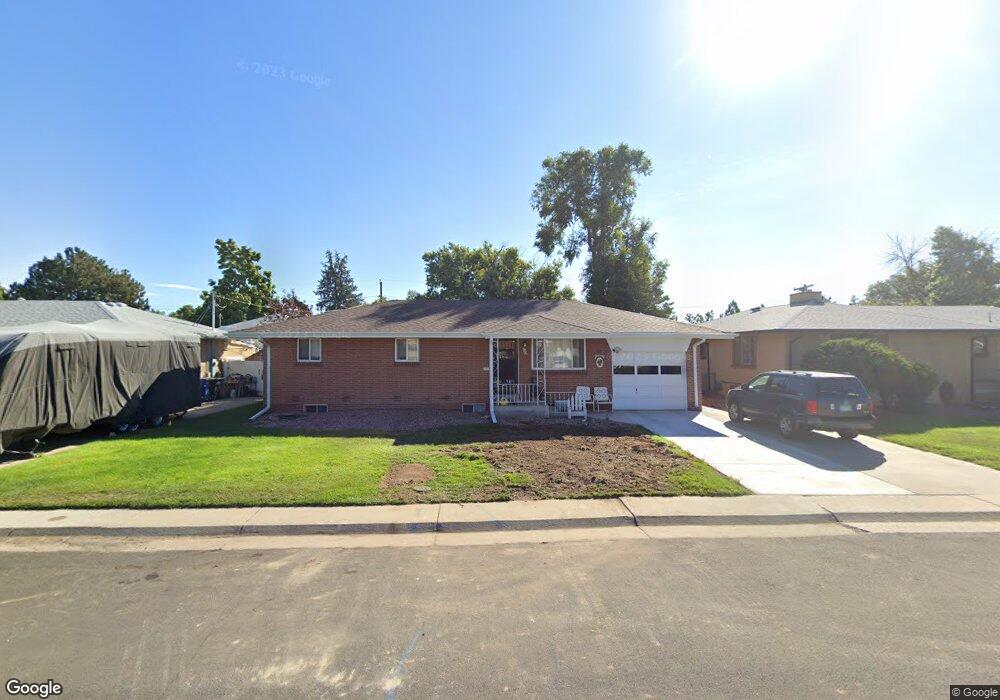
772 S 6th Ave Brighton, CO 80601
Estimated Value: $336,000 - $390,000
3
Beds
1
Bath
1,040
Sq Ft
$349/Sq Ft
Est. Value
About This Home
This home is located at 772 S 6th Ave, Brighton, CO 80601 and is currently estimated at $362,838, approximately $348 per square foot. 772 S 6th Ave is a home located in Adams County with nearby schools including South Elementary School, Vikan Middle School, and Brighton High School.
Ownership History
Date
Name
Owned For
Owner Type
Purchase Details
Closed on
Mar 31, 2003
Sold by
Smith Walter and Smith Janice
Bought by
Smith Walter C and Smith Janice J
Current Estimated Value
Purchase Details
Closed on
Sep 16, 2002
Sold by
Mills Paul and Mills Joyce
Bought by
Smith Walter and Smith Janice
Home Financials for this Owner
Home Financials are based on the most recent Mortgage that was taken out on this home.
Original Mortgage
$101,600
Interest Rate
6.25%
Purchase Details
Closed on
Dec 27, 1996
Sold by
Wendy Lutz and Wendy Mills Paul
Bought by
Mills Paul and Mills Joyce
Create a Home Valuation Report for This Property
The Home Valuation Report is an in-depth analysis detailing your home's value as well as a comparison with similar homes in the area
Home Values in the Area
Average Home Value in this Area
Purchase History
We collect this data history from publicly available records. To have your information removed, we recommend requesting removal directly through your county’s website.
| Date | Buyer | Sale Price | Title Company |
|---|---|---|---|
| Smith Walter C | -- | -- | |
| Smith Walter | $127,000 | -- | |
| Mills Paul | -- | -- |
Source: Public Records
Mortgage History
We collect this data history from publicly available records. To have your information removed, we recommend requesting removal directly through your county’s website.
| Date | Status | Borrower | Loan Amount |
|---|---|---|---|
| Closed | Smith Walter | $101,600 |
Source: Public Records
Tax History
| Year | Tax Paid | Tax Assessment Tax Assessment Total Assessment is a certain percentage of the fair market value that is determined by local assessors to be the total taxable value of land and additions on the property. | Land | Improvement |
|---|---|---|---|---|
| 2025 | $2,476 | $24,820 | $5,780 | $19,040 |
| 2024 | $2,476 | $22,810 | $5,310 | $17,500 |
| 2023 | $2,465 | $26,110 | $5,480 | $20,630 |
| 2022 | $2,392 | $21,780 | $5,630 | $16,150 |
| 2021 | $2,242 | $21,780 | $5,630 | $16,150 |
| 2020 | $1,836 | $18,590 | $5,790 | $12,800 |
| 2019 | $1,838 | $18,590 | $5,790 | $12,800 |
| 2018 | $1,256 | $12,700 | $5,760 | $6,940 |
| 2017 | $1,254 | $12,700 | $5,760 | $6,940 |
| 2016 | $1,252 | $12,630 | $3,020 | $9,610 |
| 2015 | $1,249 | $12,630 | $3,020 | $9,610 |
| 2014 | -- | $11,280 | $2,470 | $8,810 |
Source: Public Records
Map
Nearby Homes
Your Personal Tour Guide
Ask me questions while you tour the home.