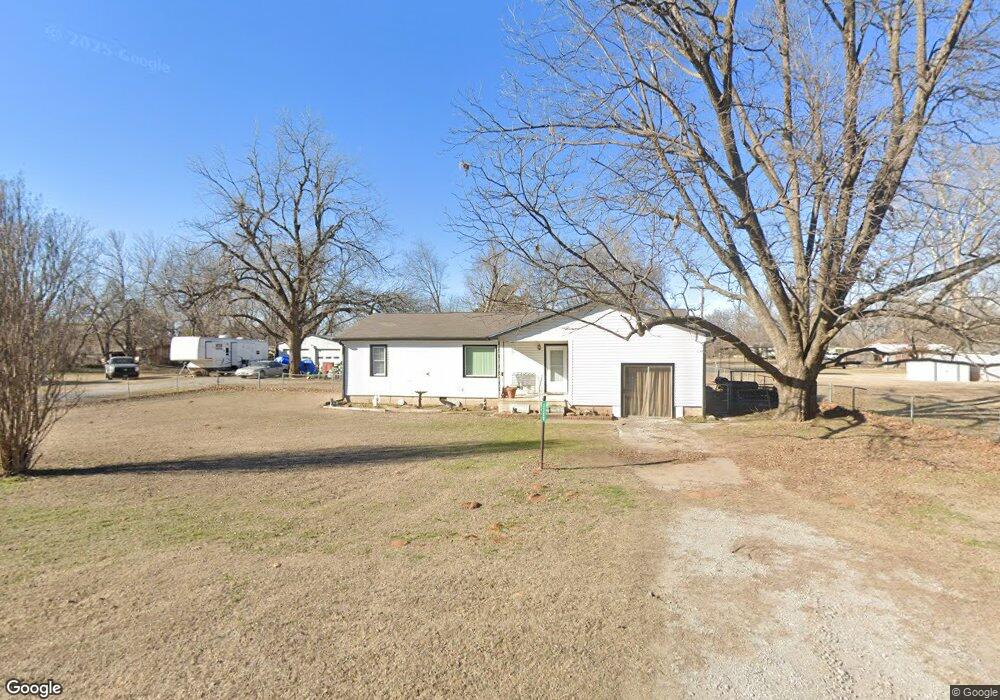
7729 E 130th St S Bixby, OK 74008
North Bixby NeighborhoodEstimated Value: $189,242 - $251,000
Studio
1
Bath
1,495
Sq Ft
$151/Sq Ft
Est. Value
About This Home
This home is located at 7729 E 130th St S, Bixby, OK 74008 and is currently estimated at $225,811, approximately $151 per square foot. 7729 E 130th St S is a home located in Tulsa County with nearby schools including Bixby North Elementary, Bixby North Intermediate, and Bixby Middle School.
Ownership History
Date
Name
Owned For
Owner Type
Purchase Details
Closed on
Jan 5, 2024
Sold by
Dowell Mike H
Bought by
Dowell Mike H and Boone Erica R
Current Estimated Value
Purchase Details
Closed on
Nov 15, 2021
Sold by
Dowell Patricia L
Bought by
Dowell Patricia L and Dowell Mike H
Purchase Details
Closed on
Sep 25, 2017
Sold by
Peckham Donald G
Bought by
Peckham Donald G
Purchase Details
Closed on
Jul 8, 2004
Sold by
Peckham Donald G and Peckham Kathryn J
Bought by
Peckham Donald G and Peckham Kathryn J
Create a Home Valuation Report for This Property
The Home Valuation Report is an in-depth analysis detailing your home's value as well as a comparison with similar homes in the area
Home Values in the Area
Average Home Value in this Area
Purchase History
| Date | Buyer | Sale Price | Title Company |
|---|---|---|---|
| Dowell Mike H | -- | None Listed On Document | |
| Dowell Patricia L | -- | None Available | |
| Peckham Donald G | -- | None Available | |
| Peckham Donald G | -- | -- |
Source: Public Records
Tax History
| Year | Tax Paid | Tax Assessment Tax Assessment Total Assessment is a certain percentage of the fair market value that is determined by local assessors to be the total taxable value of land and additions on the property. | Land | Improvement |
|---|---|---|---|---|
| 2025 | $1,130 | $8,236 | $892 | $7,344 |
| 2024 | $1,045 | $7,844 | $1,255 | $6,589 |
| 2023 | $1,045 | $7,470 | $1,479 | $5,991 |
| 2022 | $1,000 | $7,114 | $1,612 | $5,502 |
| 2021 | $759 | $5,776 | $1,308 | $4,468 |
| 2020 | $763 | $5,776 | $1,308 | $4,468 |
| 2019 | $766 | $5,776 | $1,308 | $4,468 |
| 2018 | $759 | $5,776 | $1,308 | $4,468 |
| 2017 | $754 | $6,776 | $1,535 | $5,241 |
| 2016 | $745 | $6,776 | $1,535 | $5,241 |
| 2015 | $713 | $8,932 | $2,024 | $6,908 |
| 2014 | $712 | $8,932 | $2,024 | $6,908 |
Source: Public Records
Map
Nearby Homes
- 7913 E 129th St S
- 7505 E 133rd Place S Unit 217
- 7390 E 127th St S
- 7211 E 131st Place S
- 7153 E 131st Ct S
- 13159 S 72nd East Ave
- 13178 S 72nd East Ave
- 13202 S 72nd East Ave
- 13155 S 68th East Ave
- 12564 S 71st East Ave
- 13223 S 68th East Ave
- 6950 E 127th St S
- 6951 E 125th Place S
- 12505 S 71st East Ave
- 6756 E 128th St S
- 7081 E 125th St S
- 6650 E 130th Place S
- 6685 E 128th St S
- 8703 E 126th Ct S
- 7004 E 124th St S
- 12930 S 78th East Ave
- 7824 E 129th St S
- 7720 E 129th St S
- 12923 S 77th East Ave
- 12917 S 77th East Ave
- 7730 E 130th St S
- 12930 S 78th Ave E
- 12912 S 78th East Ave
- 7716 E 129th St S
- 13002 S 78th East Ave
- 7712 E 130th St S
- 7708 E 129th St S
- 12902 S 78th East Ave
- 13010 S 78th East Ave
- 707 E 130th St S
- 704 E 130th St S
- 708 E 130th St S
- 2061 E 130th St S
- 2078 E 130th St S
- 7710 E 130th St S
Your Personal Tour Guide
Ask me questions while you tour the home.