7757 Snyder Rd Orient, OH 43146
Estimated Value: $322,000 - $464,000
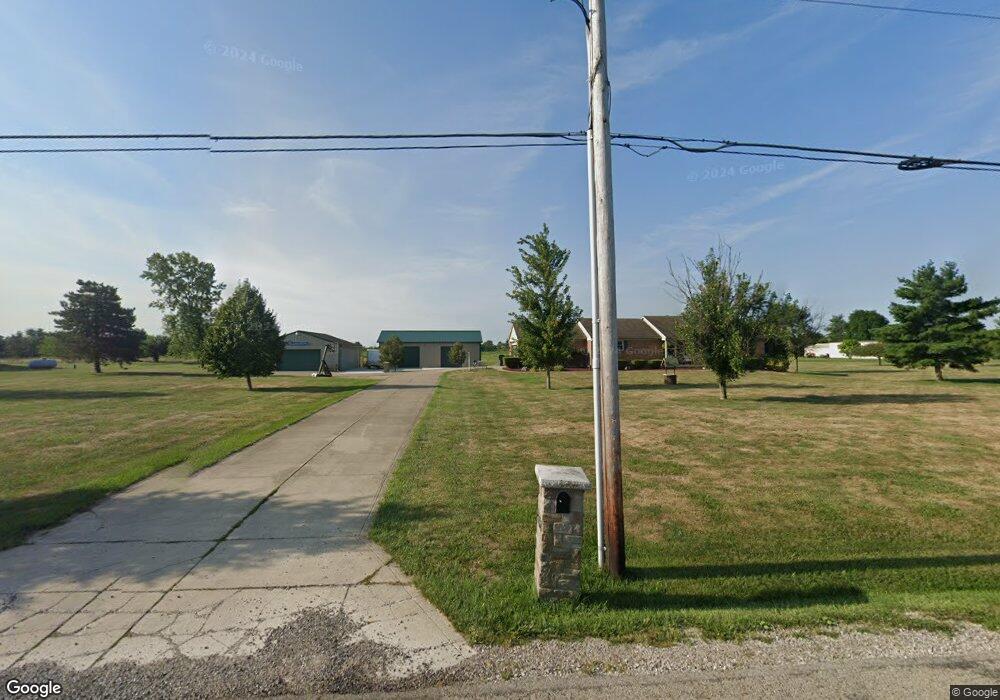
About This Home
This home is located at 7757 Snyder Rd, Orient, OH 43146 and is currently estimated at $398,711, approximately $249 per square foot. 7757 Snyder Rd is a home located in Pickaway County.
Ownership History
We collect this data history from publicly available records. To have your information removed, we recommend requesting removal directly through your county’s website.
Purchase Details
Purchase Details
Purchase History
We collect this data history from publicly available records. To have your information removed, we recommend requesting removal directly through your county’s website.
| Date | Buyer | Sale Price | Title Company |
|---|---|---|---|
| $65,000 | -- | ||
| $24,900 | -- |
Tax History
We collect this data history from publicly available records. To have your information removed, we recommend requesting removal directly through your county’s website.
| Year | Tax Paid | Tax Assessment Tax Assessment Total Assessment is a certain percentage of the fair market value that is determined by local assessors to be the total taxable value of land and additions on the property. | Land | Improvement |
|---|---|---|---|---|
| 2025 | $6,838 | $132,490 | $37,170 | $95,320 |
| 2024 | $6,838 | $132,490 | $37,170 | $95,320 |
| 2023 | $5,115 | $132,490 | $37,170 | $95,320 |
| 2022 | $3,624 | $86,290 | $24,810 | $61,480 |
| 2021 | $3,635 | $86,290 | $24,810 | $61,480 |
| 2020 | $3,636 | $86,290 | $24,810 | $61,480 |
| 2019 | $3,151 | $72,670 | $23,830 | $48,840 |
| 2018 | $2,912 | $72,670 | $23,830 | $48,840 |
| 2017 | $2,988 | $72,670 | $23,830 | $48,840 |
| 2016 | $2,857 | $69,320 | $21,370 | $47,950 |
| 2015 | $2,859 | $69,320 | $21,370 | $47,950 |
| 2014 | $2,863 | $69,320 | $21,370 | $47,950 |
| 2013 | $2,993 | $69,680 | $21,370 | $48,310 |
Map
- 9148 Matville Rd
- 213 Red Oak Pass
- 191 Red Oak Ct
- 159 Chestnut Commons Dr
- 171 Cherrytree Ln
- 173 Butternut Pass
- 197 Honey Locust Ln
- 9056 Burgett Rd
- 0 Burgett Rd
- 11200 Coontz Rd
- 10440 Borror Rd
- 66 Genoa Cir
- 30 Waterman Ave
- 52 Genoa Cir
- 420 Lockbay Rd
- 290 Olympic Loop
- 304 Mahogany Ln
- 289 Arledge Dr
- 24 Erin Hills Rd
- 291 Flint Ct
Ask me questions while you tour the home.