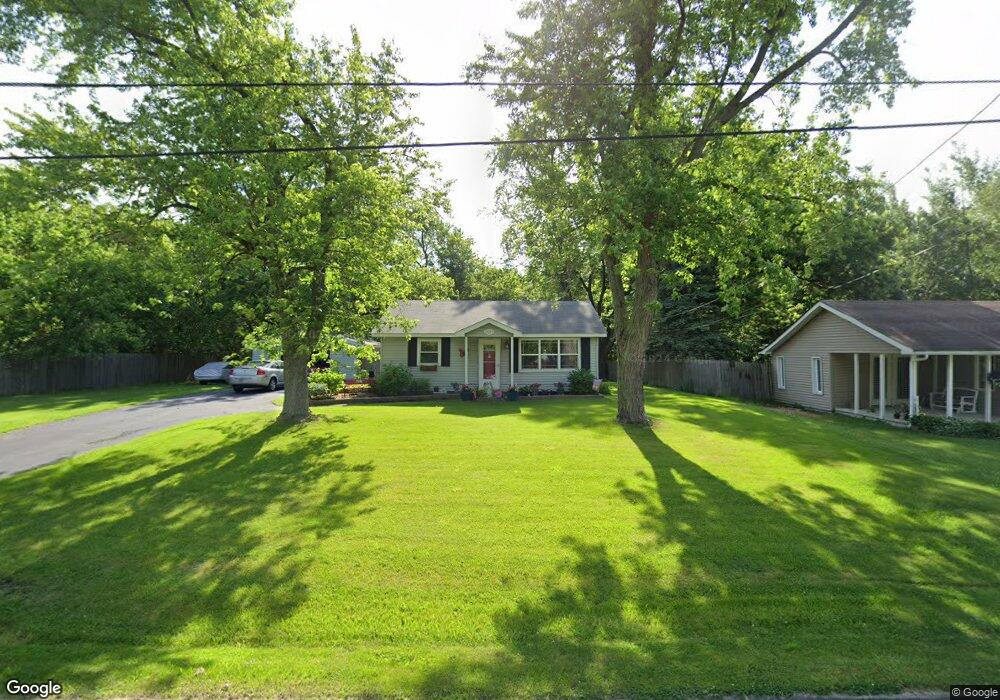
7829 Ruth St Dyer, IN 46311
Hartsdale NeighborhoodEstimated Value: $208,000 - $229,926
2
Beds
1
Bath
1,690
Sq Ft
$131/Sq Ft
Est. Value
About This Home
This home is located at 7829 Ruth St, Dyer, IN 46311 and is currently estimated at $221,982, approximately $131 per square foot. 7829 Ruth St is a home located in Lake County with nearby schools including George Bibich Elementary School, Kahler Middle School, and Lake Central High School.
Ownership History
Date
Name
Owned For
Owner Type
Purchase Details
Closed on
May 29, 2009
Sold by
Golembiewski Florian M
Bought by
Golembiewski Florian M and Golembiewski Elizabeth A
Current Estimated Value
Home Financials for this Owner
Home Financials are based on the most recent Mortgage that was taken out on this home.
Original Mortgage
$88,000
Interest Rate
4.85%
Mortgage Type
New Conventional
Create a Home Valuation Report for This Property
The Home Valuation Report is an in-depth analysis detailing your home's value as well as a comparison with similar homes in the area
Home Values in the Area
Average Home Value in this Area
Purchase History
| Date | Buyer | Sale Price | Title Company |
|---|---|---|---|
| Golembiewski Florian M | -- | Northwest Indiana Title |
Source: Public Records
Mortgage History
| Date | Status | Borrower | Loan Amount |
|---|---|---|---|
| Closed | Golembiewski Florian M | $88,000 |
Source: Public Records
Tax History
| Year | Tax Paid | Tax Assessment Tax Assessment Total Assessment is a certain percentage of the fair market value that is determined by local assessors to be the total taxable value of land and additions on the property. | Land | Improvement |
|---|---|---|---|---|
| 2025 | $1,323 | $212,700 | $110,600 | $102,100 |
| 2024 | $3,099 | $207,100 | $110,600 | $96,500 |
| 2023 | $1,247 | $187,700 | $100,200 | $87,500 |
| 2022 | $1,247 | $173,300 | $100,200 | $73,100 |
| 2021 | $1,193 | $171,400 | $100,200 | $71,200 |
| 2020 | $730 | $123,400 | $48,700 | $74,700 |
| 2019 | $775 | $113,700 | $23,400 | $90,300 |
| 2018 | $776 | $113,300 | $23,400 | $89,900 |
| 2017 | $732 | $113,300 | $23,400 | $89,900 |
| 2016 | $570 | $98,300 | $23,400 | $74,900 |
| 2014 | $491 | $100,800 | $23,300 | $77,500 |
| 2013 | $466 | $97,900 | $23,300 | $74,600 |
Source: Public Records
Map
Nearby Homes
- 14207 Jay St
- 14211 Jay St
- 14205 Jay St
- 2711 Edgewood Dr
- 13700 W 81st Ave
- 505 Brittany Ln
- 11015 Delta Dr
- 2545 Fossil Stone Rd
- 3048 Brampton Ln
- 13840 Laurel Ct
- 2428 Rolling Hill Dr
- 2417 Hickory Dr
- 225 Beiriger Dr
- 192 Summerhill Dr
- 2710 Wood Dr Unit 46311
- 515 Meadow Brooke Ln
- 2308 Flint Ct
- 516 Meadow Brooke Ln
- 1459 Carriage Oaks Ct
- 48 Summerhill Dr
Your Personal Tour Guide
Ask me questions while you tour the home.