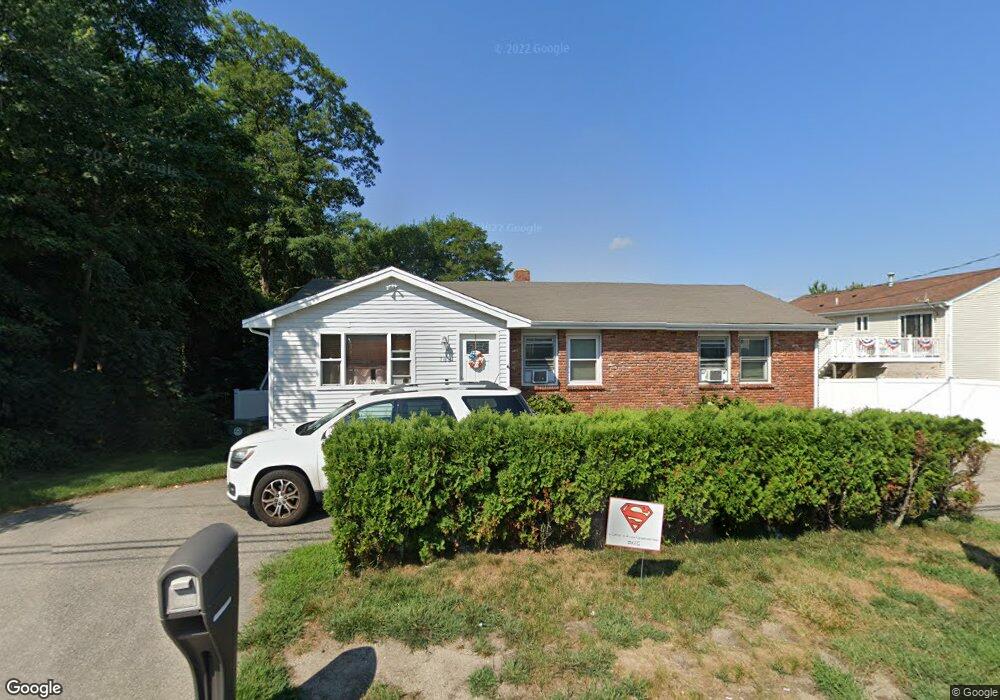
783 Metacom Ave Bristol, RI 02809
Bristol Highlands NeighborhoodEstimated Value: $430,956 - $534,000
3
Beds
2
Baths
1,112
Sq Ft
$425/Sq Ft
Est. Value
About This Home
This home is located at 783 Metacom Ave, Bristol, RI 02809 and is currently estimated at $472,739, approximately $425 per square foot. 783 Metacom Ave is a home located in Bristol County with nearby schools including Mt. Hope High School, Highlander Charter Middle and High School, and East Bay Career Academy.
Ownership History
Date
Name
Owned For
Owner Type
Purchase Details
Closed on
Feb 8, 2021
Sold by
Murphy Michelle A
Bought by
Murphy Michelle A and Murphy Sean P
Current Estimated Value
Home Financials for this Owner
Home Financials are based on the most recent Mortgage that was taken out on this home.
Original Mortgage
$248,000
Outstanding Balance
$177,282
Interest Rate
2.65%
Mortgage Type
New Conventional
Estimated Equity
$295,457
Purchase Details
Closed on
Dec 30, 2014
Sold by
Murphy Michelle A
Bought by
Murphy Michelle A
Home Financials for this Owner
Home Financials are based on the most recent Mortgage that was taken out on this home.
Original Mortgage
$196,000
Interest Rate
4.02%
Mortgage Type
New Conventional
Purchase Details
Closed on
Jul 22, 2010
Sold by
Silva Joseph G
Bought by
Oliveira Michelle A
Home Financials for this Owner
Home Financials are based on the most recent Mortgage that was taken out on this home.
Original Mortgage
$205,236
Interest Rate
4.76%
Mortgage Type
Purchase Money Mortgage
Purchase Details
Closed on
Nov 27, 2006
Sold by
Urban John J
Bought by
Silva Joseph G
Home Financials for this Owner
Home Financials are based on the most recent Mortgage that was taken out on this home.
Original Mortgage
$188,100
Interest Rate
6.39%
Mortgage Type
Purchase Money Mortgage
Create a Home Valuation Report for This Property
The Home Valuation Report is an in-depth analysis detailing your home's value as well as a comparison with similar homes in the area
Home Values in the Area
Average Home Value in this Area
Purchase History
We collect this data history from publicly available records. To have your information removed, we recommend requesting removal directly through your county’s website.
| Date | Buyer | Sale Price | Title Company |
|---|---|---|---|
| Murphy Michelle A | -- | None Available | |
| Murphy Michelle A | -- | -- | |
| Oliveira Michelle A | $208,000 | -- | |
| Silva Joseph G | $198,000 | -- |
Source: Public Records
Mortgage History
We collect this data history from publicly available records. To have your information removed, we recommend requesting removal directly through your county’s website.
| Date | Status | Borrower | Loan Amount |
|---|---|---|---|
| Open | Murphy Michelle A | $248,000 | |
| Previous Owner | Silva Joseph G | $196,000 | |
| Previous Owner | Silva Joseph G | $205,236 | |
| Previous Owner | Silva Joseph G | $188,100 | |
| Previous Owner | Silva Joseph G | $14,000 |
Source: Public Records
Tax History
| Year | Tax Paid | Tax Assessment Tax Assessment Total Assessment is a certain percentage of the fair market value that is determined by local assessors to be the total taxable value of land and additions on the property. | Land | Improvement |
|---|---|---|---|---|
| 2025 | $3,828 | $277,000 | $133,500 | $143,500 |
| 2024 | $3,828 | $277,000 | $133,500 | $143,500 |
| 2023 | $3,701 | $277,000 | $133,500 | $143,500 |
| 2022 | $3,601 | $277,000 | $133,500 | $143,500 |
| 2021 | $3,300 | $229,500 | $119,000 | $110,500 |
| 2020 | $3,215 | $228,500 | $119,000 | $109,500 |
| 2019 | $3,135 | $228,500 | $119,000 | $109,500 |
| 2018 | $3,760 | $244,500 | $135,000 | $109,500 |
| 2017 | $3,041 | $203,800 | $114,200 | $89,600 |
| 2016 | $3,010 | $203,800 | $114,200 | $89,600 |
| 2015 | $2,859 | $203,800 | $114,200 | $89,600 |
| 2014 | $2,928 | $224,220 | $121,500 | $102,720 |
Source: Public Records
Map
Nearby Homes
- 770 Metacom Ave
- 5 Saint Theresa Ave
- 48 Fatima Dr
- 1 Saint Anna Ave
- 0 Overhill Lot 1 Rd Unit 1405163
- 5 Casey Dr
- 36 Munro Ave
- 11 Terrace Dr
- 10 Read Ave
- 5 Village Rd
- 596 Metacom Ave
- 34 Brooks Farm Dr
- 6 Englewood Ct
- 506 Clarks Row
- 24 Seymour St
- 8 Birchwood Dr
- 24 Sandy Ln
- 414 North Ln
- 1300 Hope St
- 21 Smith St
- 1 Sachem Rd
- 3 Sachem Rd
- 772 Metacom Ave
- 774 Metacom Ave
- 776 Metacom Ave
- 2 Sachem Rd
- 5 Sachem Rd
- 7 Saint Theresa Ave
- 766 Metacom Ave
- 11 Saint Theresa Ave
- 11 St Theresa Ave
- 4 Sachem Rd
- 9 Saint Theresa Ave
- 15 Saint Theresa Ave
- 15 St Theresa Ave
- 789 Metacom Ave
- 3 Saint Theresa Ave
- 6 Sachem Rd
- 762 Metacom Ave
- 17 Saint Theresa Ave
Your Personal Tour Guide
Ask me questions while you tour the home.