
Seller's Agent in 2025
Tyler Mitosinka
Brookstone, Realtors LLC
(248) 660-4467
3 in this area
14 Total Sales
Estimated Value: $317,696 - $356,000
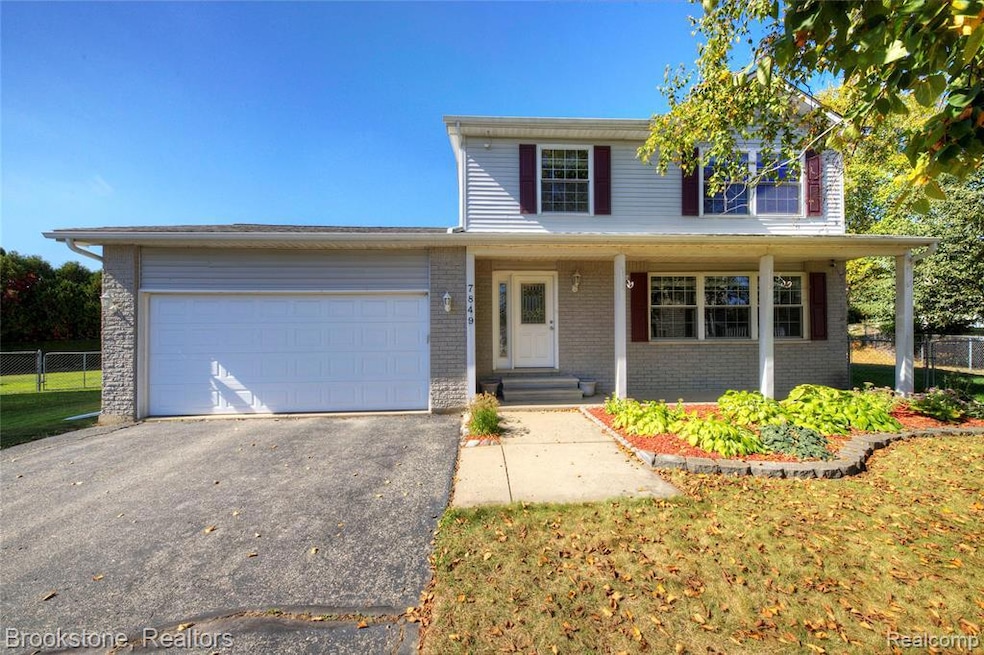
A perfect opportunity! Clarkston School District in Waterford Twp. Just a short jaunt to Maceday/Lotus Lake, and near Pontiac Lake State Park, and IndianSprings Metropark - the outdoor fun is endless! Highlights inside include a partially finished basement, open kitchen/dining/living space, spacious primary suite, and ample storage. Outside you'll enjoy the sprawling back deck, covered front porch, large shed, and greenhouse for gardening. Come check it out before it's gone!
Last Agent to Sell the Property
Brookstone, Realtors LLC License #6501399611 Listed on: 10/02/2025
We collect this data history from publicly available records. To have your information removed, we recommend requesting removal directly through your county’s website.
| Date | Buyer | Sale Price | Title Company |
|---|---|---|---|
| Everhart Ashley | $320,000 | None Listed On Document | |
| Tonyea S Vanpatten Living Trust | -- | None Listed On Document | |
| Vanoatteb Tonyea | -- | None Available | |
| Vanpatten Kalanquin Tonyea | -- | Cislo Title Company | |
| Kalanquin Donald | -- | None Available | |
| Kalanquin John A | $130,000 | Capital Title Ins Agency | |
| Mortgage Electronic Registration Systems | $119,000 | None Available | |
| Hollmeyer Jack F | $190,000 | -- | |
| Hollmeyer Jack F | -- | -- |
We collect this data history from publicly available records. To have your information removed, we recommend requesting removal directly through your county’s website.
| Date | Status | Borrower | Loan Amount |
|---|---|---|---|
| Open | Everhart Ashley | $288,000 |
| Date | Event | Price | List to Sale | Price per Sq Ft |
|---|---|---|---|---|
| 11/12/2025 11/12/25 | Sold | $320,000 | -1.5% | $219 / Sq Ft |
| 10/15/2025 10/15/25 | Pending | -- | -- | -- |
| 10/02/2025 10/02/25 | For Sale | $325,000 | -- | $223 / Sq Ft |
| Year | Tax Paid | Tax Assessment Tax Assessment Total Assessment is a certain percentage of the fair market value that is determined by local assessors to be the total taxable value of land and additions on the property. | Land | Improvement |
|---|---|---|---|---|
| 2025 | $1,629 | $139,330 | $0 | $0 |
| 2024 | $1,584 | $129,250 | $0 | $0 |
| 2023 | $1,510 | $112,000 | $0 | $0 |
| 2022 | $2,479 | $99,240 | $0 | $0 |
| 2021 | $2,289 | $94,610 | $0 | $0 |
| 2020 | $1,383 | $89,300 | $0 | $0 |
| 2019 | $2,236 | $78,980 | $0 | $0 |
| 2018 | $2,203 | $88,570 | $0 | $0 |
| 2017 | $2,026 | $88,570 | $0 | $0 |
| 2016 | $2,034 | $86,560 | $0 | $0 |
| 2015 | -- | $72,730 | $0 | $0 |
| 2014 | -- | $58,020 | $0 | $0 |
| 2011 | -- | $55,740 | $0 | $0 |
Seller's Agent in 2025
Tyler Mitosinka
Brookstone, Realtors LLC
(248) 660-4467
3 in this area
14 Total Sales
Buyer's Agent in 2025
Eileen Reynolds
HomePointe Realty LLC
(248) 884-4913
6 in this area
60 Total Sales
Source: Realcomp
MLS Number: 20251041902
APN: 13-06-151-022
Disclaimer: Certain information contained herein is derived from information provided by parties other than Homes.com. All information provided is deemed reliable, but is not guaranteed to be accurate and should be independently verified.
![]() IDX provided courtesy of Realcomp II Ltd. via Ten-X and MLS
IDX provided courtesy of Realcomp II Ltd. via Ten-X and MLS
Copyright 2026 Realcomp II Ltd. Shareholders
IDX information is provided exclusively for consumers' personal, noncommercial use and may not be used for any purpose other than to identify prospective properties consumers may be interested in purchasing. The accuracy of all information, regardless of source, is not guaranteed or warranted. All information should be independently verified.
Listing Information presented by local MLS brokerage: Ten-X, local REALTOR®- Arlene Richardson - (888)-952-6393
Ask me questions while you tour the home.