7887 E Uhl St Tucson, AZ 85710
Broadway Pantano East NeighborhoodAbout This Home
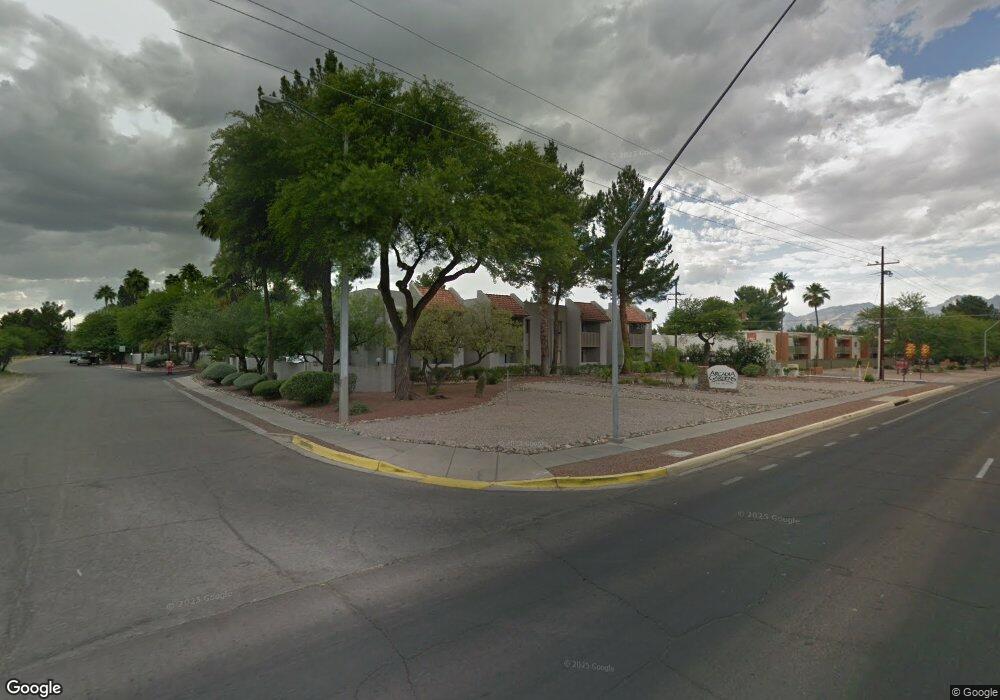
Discover a finer element of apartment home living at Element on the Loop in east Tucson, Arizona. Our premier location grants easy access to major shopping centers, delicious dining, and all the best our city has to offer, like Gaslight Theatre. Nestled against the Pantano Wash near several parks, our residents enjoy the beauty of our desert and the convenience of urban living. Close proximity to major highways enables seamless travel to recreation and entertainment across the valley.
Home Values in the Area
Average Home Value in this Area
Property History
We collect this data history from publicly available records. To have your information removed, we recommend requesting removal directly through your county’s website.
| Date | Event | Price | List to Sale | Price per Sq Ft |
|---|---|---|---|---|
| 10/04/2025 10/04/25 | Off Market | -- | -- | -- |
| 09/20/2025 09/20/25 | Price Changed | $799 | -3.6% | $2 / Sq Ft |
| 09/16/2025 09/16/25 | Price Changed | $829 | -7.8% | $2 / Sq Ft |
| 09/05/2025 09/05/25 | Price Changed | $899 | +8.4% | $2 / Sq Ft |
| 07/31/2025 07/31/25 | Price Changed | $829 | 0.0% | $2 / Sq Ft |
| 07/16/2025 07/16/25 | Price Changed | $829 | -2.4% | $2 / Sq Ft |
| 07/10/2025 07/10/25 | Price Changed | $849 | -5.6% | $2 / Sq Ft |
| 06/16/2025 06/16/25 | Price Changed | $899 | +5.9% | $2 / Sq Ft |
| 03/14/2025 03/14/25 | Price Changed | $849 | +13.4% | $2 / Sq Ft |
| 02/04/2025 02/04/25 | Price Changed | $749 | -6.3% | $2 / Sq Ft |
| 12/04/2024 12/04/24 | Price Changed | $799 | -3.6% | $2 / Sq Ft |
| 10/25/2024 10/25/24 | Price Changed | $829 | -2.4% | $2 / Sq Ft |
| 07/15/2024 07/15/24 | Price Changed | $849 | -5.6% | $2 / Sq Ft |
| 07/13/2024 07/13/24 | For Rent | $899 | -- | -- |
Tax History
We collect this data history from publicly available records. To have your information removed, we recommend requesting removal directly through your county’s website.
| Year | Tax Paid | Tax Assessment Tax Assessment Total Assessment is a certain percentage of the fair market value that is determined by local assessors to be the total taxable value of land and additions on the property. | Land | Improvement |
|---|---|---|---|---|
| 2026 | $47,262 | $375,160 | -- | -- |
| 2025 | $47,262 | $357,296 | -- | -- |
| 2024 | $45,340 | $340,282 | -- | -- |
| 2023 | $42,778 | $324,078 | $0 | $0 |
| 2022 | $42,988 | $308,645 | $0 | $0 |
| 2021 | $42,739 | $279,950 | $0 | $0 |
| 2020 | $41,440 | $325,932 | $0 | $0 |
| 2019 | $40,893 | $266,619 | $0 | $0 |
| 2018 | $43,351 | $262,102 | $0 | $0 |
| 2017 | $43,107 | $262,102 | $0 | $0 |
| 2016 | $41,621 | $249,621 | $0 | $0 |
| 2015 | $42,351 | $249,621 | $0 | $0 |
Map
- 602 S Pantano Rd Unit C
- 8041 E Julia St
- 677 S Pantano Pkwy
- 8060 E Broadway Blvd Unit E110
- 8060 E Broadway Blvd Unit 212
- 8050 E Broadway Blvd Unit D105
- 8185 E Mesquite Ridge Cir
- 8040 E Broadway Blvd Unit C104
- 851 S Pantano Pkwy
- 8030 E Broadway Blvd Unit B-205
- 896 S Pantano Rd
- 8150 E Broadway Blvd Unit H-202
- 8040 E Eli St
- 8160 E Broadway Blvd Unit J-4
- 603 S Liana Ct
- 8140 E Broadway Blvd Unit G-111
- 8140 E Broadway Blvd Unit G103
- 7957 E 19th Place
- 925 S Pantano Pkwy
- 802 S Sherwood Village Dr
- 7850 E Uhl St
- 260 S Pantano Rd Unit 212
- 260 S Pantano Rd Unit 161
- 260 S Pantano Rd Unit 109
- 260 S Pantano Rd Unit 202
- 260 S Pantano Rd Unit 219
- 260 S Pantano Rd Unit 102
- 260 S Pantano Rd Unit 101
- 260 S Pantano Rd
- 260 S Pantano Rd
- 260 S Pantano Rd Unit 264
- 260 S Pantano Rd Unit 165
- 260 S Pantano Rd Unit 159
- 260 S Pantano Rd Unit 117
- 260 S Pantano Rd Unit 118
- 260 S Pantano Rd Unit 215
- 260 S Pantano Rd Unit 168
- 260 S Pantano Rd Unit 105
- 260 S Pantano Rd Unit 111
- 401 S Desert Dream Place
Ask me questions while you tour the home.