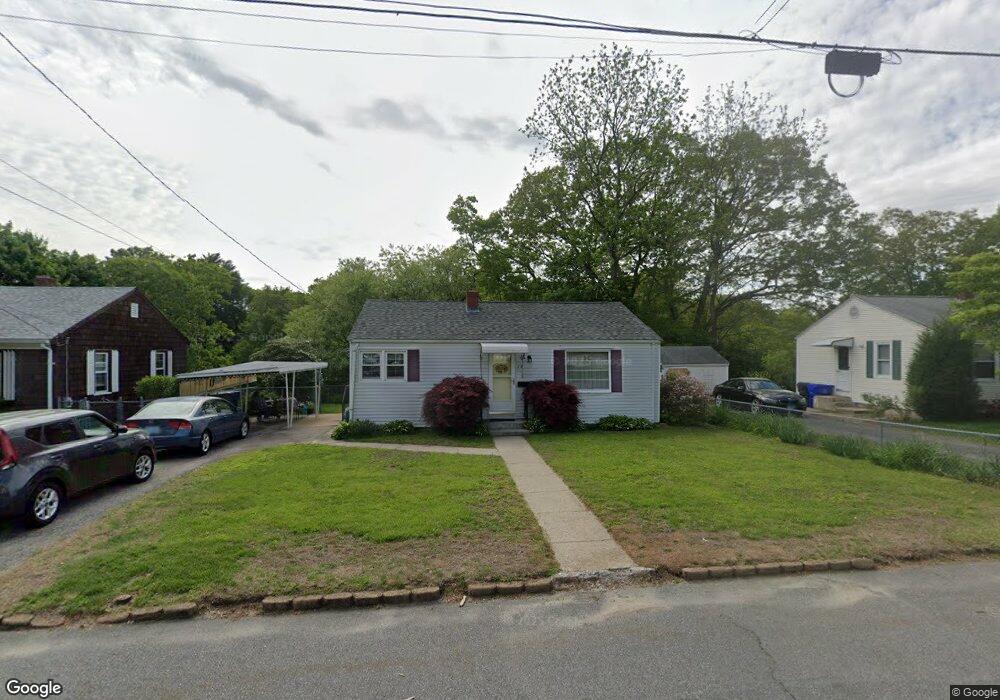
79 Border St West Warwick, RI 02893
West Warwick Centre NeighborhoodEstimated Value: $330,000 - $377,000
2
Beds
1
Bath
816
Sq Ft
$434/Sq Ft
Est. Value
About This Home
This home is located at 79 Border St, West Warwick, RI 02893 and is currently estimated at $353,826, approximately $433 per square foot. 79 Border St is a home located in Kent County with nearby schools including West Warwick High School, Islamic School of Rhode Island, and St Joseph School.
Ownership History
Date
Name
Owned For
Owner Type
Purchase Details
Closed on
Dec 14, 2007
Sold by
Hernandez Thomas P
Bought by
Gagnon Judith A
Current Estimated Value
Home Financials for this Owner
Home Financials are based on the most recent Mortgage that was taken out on this home.
Original Mortgage
$75,000
Interest Rate
6.3%
Mortgage Type
Purchase Money Mortgage
Purchase Details
Closed on
Apr 23, 2004
Sold by
Koeth Chemin T
Bought by
Hernandez Thomas P
Home Financials for this Owner
Home Financials are based on the most recent Mortgage that was taken out on this home.
Original Mortgage
$120,000
Interest Rate
5.4%
Mortgage Type
Purchase Money Mortgage
Purchase Details
Closed on
Jan 10, 2002
Sold by
Boisvert Kathleen M
Bought by
Koeth Chemin T
Purchase Details
Closed on
Jul 17, 1995
Sold by
Sanquist Catherine A
Bought by
Boisvert Kathleen M
Create a Home Valuation Report for This Property
The Home Valuation Report is an in-depth analysis detailing your home's value as well as a comparison with similar homes in the area
Home Values in the Area
Average Home Value in this Area
Purchase History
We collect this data history from publicly available records. To have your information removed, we recommend requesting removal directly through your county’s website.
| Date | Buyer | Sale Price | Title Company |
|---|---|---|---|
| Gagnon Judith A | $180,000 | -- | |
| Hernandez Thomas P | $160,000 | -- | |
| Koeth Chemin T | $108,000 | -- | |
| Boisvert Kathleen M | $77,000 | -- |
Source: Public Records
Mortgage History
We collect this data history from publicly available records. To have your information removed, we recommend requesting removal directly through your county’s website.
| Date | Status | Borrower | Loan Amount |
|---|---|---|---|
| Open | Boisvert Kathleen M | $75,000 | |
| Closed | Boisvert Kathleen M | $75,000 | |
| Previous Owner | Boisvert Kathleen M | $120,000 |
Source: Public Records
Tax History
| Year | Tax Paid | Tax Assessment Tax Assessment Total Assessment is a certain percentage of the fair market value that is determined by local assessors to be the total taxable value of land and additions on the property. | Land | Improvement |
|---|---|---|---|---|
| 2025 | $3,807 | $266,400 | $105,000 | $161,400 |
| 2024 | $3,643 | $194,900 | $75,100 | $119,800 |
| 2023 | $3,571 | $194,900 | $75,100 | $119,800 |
| 2022 | $3,516 | $194,900 | $75,100 | $119,800 |
| 2021 | $3,261 | $141,800 | $55,500 | $86,300 |
| 2020 | $3,261 | $141,800 | $55,500 | $86,300 |
| 2019 | $4,158 | $141,800 | $55,500 | $86,300 |
| 2018 | $2,862 | $105,300 | $45,600 | $59,700 |
| 2017 | $2,770 | $105,300 | $45,600 | $59,700 |
| 2016 | $2,721 | $105,300 | $45,600 | $59,700 |
| 2015 | $2,601 | $100,200 | $45,600 | $54,600 |
| 2014 | $636 | $100,200 | $45,600 | $54,600 |
Source: Public Records
Map
Nearby Homes
- 11 Seth Dr
- 12 Grove St
- 13 Earl St
- 2 Duke St Unit D
- 15 Jodoin St
- 37 Gerald St
- 7 Shippee Ave
- 30 Potter Ave
- 1567 Centerville Rd
- 6 Middle St
- 10 Walnut St
- 27 Standard Ave
- 70 East St
- 28 Youngs Ave
- 6 Legris Commons Ln Unit 5
- 8 Lenox Ave
- 44 Capron St
- 185 Legris Ave
- 325 Washington St Unit 1
- 55 South St Unit 1
Your Personal Tour Guide
Ask me questions while you tour the home.