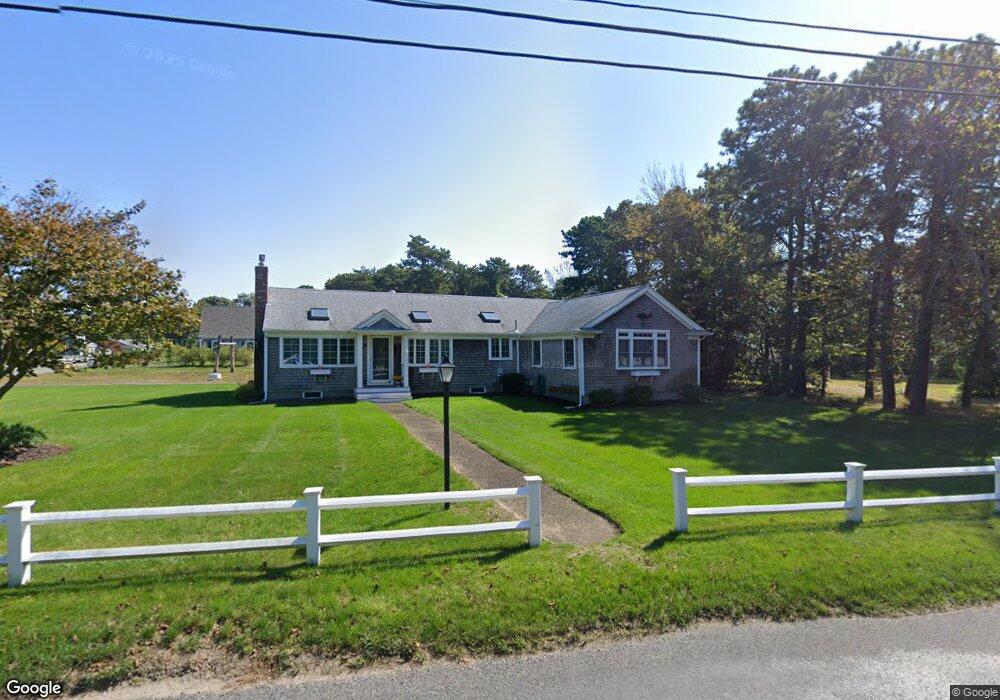
79 Chase Ave West Dennis, MA 2670
West Dennis Neighborhood
Studio
--
Bath
--
Sq Ft
3.42
Acres Lot
About This Home
This home is located at 79 Chase Ave, West Dennis, MA 2670. 79 Chase Ave is a home located in Barnstable County with nearby schools including Dennis-Yarmouth Regional High School and St. Pius X. School.
Ownership History
We collect this data history from publicly available records. To have your information removed, we recommend requesting removal directly through your county’s website.
Date
Name
Owned For
Owner Type
Purchase Details
Closed on
Apr 7, 2021
Sold by
Bought by
Purchase Details
Closed on
Dec 23, 2019
Sold by
Bought by
Purchase Details
Closed on
Feb 6, 2015
Sold by
Bought by
Purchase Details
Closed on
Oct 17, 2014
Sold by
Bought by
Purchase Details
Closed on
Nov 18, 2013
Sold by
Bought by
Purchase Details
Closed on
Aug 1, 2012
Sold by
Bought by
Purchase Details
Closed on
Jan 31, 2011
Sold by
Bought by
Purchase Details
Closed on
May 15, 2007
Sold by
Bought by
Purchase Details
Closed on
Sep 10, 2002
Sold by
Bought by
Purchase Details
Closed on
May 13, 2002
Sold by
Bought by
Purchase Details
Closed on
Oct 23, 2000
Sold by
Bought by
Purchase Details
Closed on
Aug 25, 2000
Sold by
Bought by
Purchase Details
Closed on
Dec 4, 1997
Sold by
Bought by
Purchase Details
Closed on
Nov 3, 1997
Sold by
Bought by
Purchase Details
Closed on
Jan 30, 1996
Sold by
Bought by
Purchase Details
Closed on
May 9, 1995
Sold by
Bought by
Purchase Details
Closed on
Apr 20, 1995
Sold by
Bought by
Purchase Details
Closed on
Dec 22, 1993
Sold by
Bought by
Purchase Details
Closed on
Oct 22, 1993
Sold by
Bought by
Purchase Details
Closed on
Sep 27, 1993
Sold by
Bought by
Create a Home Valuation Report for This Property
The Home Valuation Report is an in-depth analysis detailing your home's value as well as a comparison with similar homes in the area
Home Values in the Area
Average Home Value in this Area
Purchase History
We collect this data history from publicly available records. To have your information removed, we recommend requesting removal directly through your county’s website.
| Date | Buyer | Sale Price | Title Company |
|---|---|---|---|
| -- | None Available | ||
| -- | None Available | ||
| -- | None Available | ||
| -- | None Available | ||
| -- | None Available | ||
| -- | None Available | ||
| $142,130 | -- | ||
| $142,130 | -- | ||
| $142,130 | -- | ||
| -- | -- | ||
| -- | -- | ||
| -- | -- | ||
| -- | -- | ||
| -- | -- | ||
| -- | -- | ||
| -- | -- | ||
| -- | -- | ||
| $654,007 | -- | ||
| $654,007 | -- | ||
| $654,007 | -- | ||
| $158,164 | -- | ||
| $158,164 | -- | ||
| $75,460 | -- | ||
| $64,500 | -- | ||
| $64,500 | -- | ||
| $90,000 | -- | ||
| $90,000 | -- | ||
| $10,000 | -- | ||
| $22,500 | -- | ||
| $22,500 | -- | ||
| $30,000 | -- | ||
| $30,000 | -- | ||
| $13,000 | -- | ||
| $13,000 | -- | ||
| $19,100 | -- | ||
| $19,100 | -- | ||
| $10,000 | -- | ||
| $10,000 | -- | ||
| $10,000 | -- | ||
| $24,033 | -- | ||
| $30,000 | -- | ||
| $30,000 | -- | ||
| $20,000 | -- | ||
| $20,000 | -- | ||
| $26,300 | -- | ||
| $26,300 | -- | ||
| $20,400 | -- | ||
| $20,400 | -- | ||
| $16,000 | -- | ||
| $16,000 | -- |
Source: Public Records
Tax History
We collect this data history from publicly available records. To have your information removed, we recommend requesting removal directly through your county’s website.
| Year | Tax Paid | Tax Assessment Tax Assessment Total Assessment is a certain percentage of the fair market value that is determined by local assessors to be the total taxable value of land and additions on the property. | Land | Improvement |
|---|---|---|---|---|
| 2025 | $63,690 | $14,708,900 | $6,663,100 | $8,045,800 |
| 2024 | $62,873 | $14,321,900 | $6,420,700 | $7,901,200 |
| 2023 | $63,682 | $13,636,400 | $6,115,500 | $7,520,900 |
| 2022 | $72,402 | $12,928,900 | $5,768,900 | $7,160,000 |
| 2021 | $75,881 | $12,583,900 | $5,655,800 | $6,928,100 |
| 2020 | $75,778 | $12,422,600 | $5,613,600 | $6,809,000 |
| 2019 | $76,791 | $12,445,800 | $5,613,600 | $6,832,200 |
| 2018 | $78,948 | $12,452,400 | $5,613,600 | $6,838,800 |
| 2017 | $76,560 | $12,448,700 | $5,613,600 | $6,835,100 |
| 2016 | $77,062 | $11,801,200 | $5,613,600 | $6,187,600 |
| 2015 | $75,528 | $11,801,200 | $5,613,600 | $6,187,600 |
| 2014 | $63,243 | $9,959,500 | $5,613,600 | $4,345,900 |
Source: Public Records
Map
Nearby Homes
- 61 Chase Ave
- 67 Chase Ave
- 57 Chase Ave
- 112 Uncle Barneys Rd
- 60 Chase Ave
- 76 Chase Ave
- 82 Chase Ave
- 56 Chase Ave
- 0 Uncle Barneys Rd
- 40 Chase Ave
- 88 Chase Ave
- 118 Uncle Barneys Rd
- 36 Chase Ave
- 36 Chase Ave
- 100 Uncle Barneys Rd
- 21 Chase Ave
- 115 Uncle Barneys Rd
- 2 Uncle Freemans Rd
- 33 Chase Ave
- 105 Uncle Barneys Rd
Your Personal Tour Guide
Ask me questions while you tour the home.