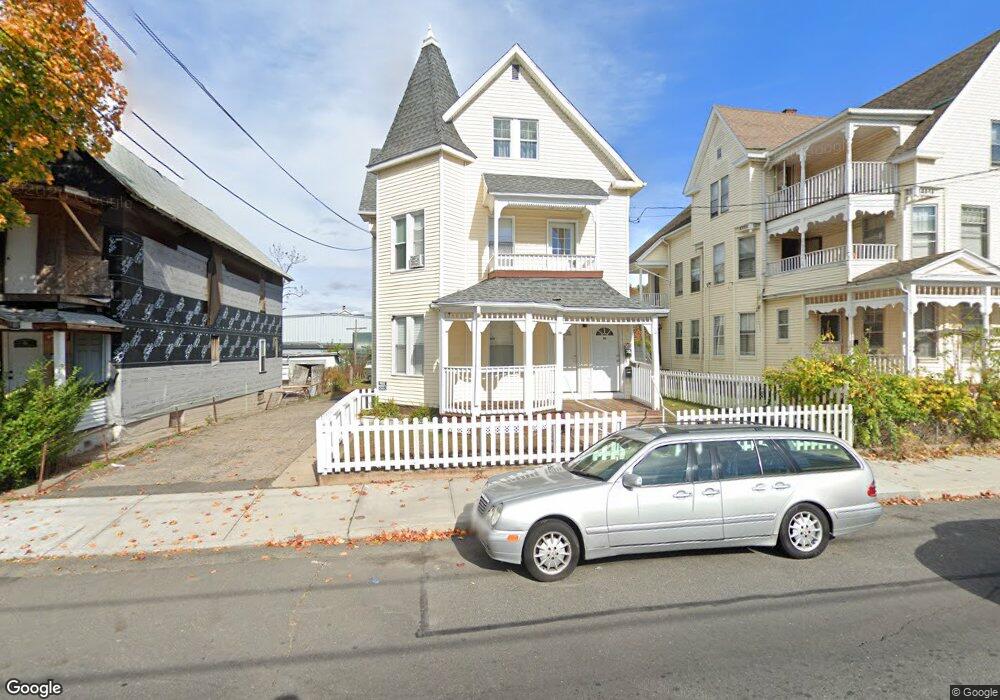
79 E Farm St Waterbury, CT 06704
North End District NeighborhoodEstimated Value: $104,565 - $471,000
6
Beds
3
Baths
3,214
Sq Ft
$108/Sq Ft
Est. Value
About This Home
This home is located at 79 E Farm St, Waterbury, CT 06704 and is currently estimated at $345,891, approximately $107 per square foot. 79 E Farm St is a home located in New Haven County with nearby schools including Wilby High School, Alpha & Omega Christian Academy, and Mesivta Ateres Shmuel of Waterbury.
Ownership History
Date
Name
Owned For
Owner Type
Purchase Details
Closed on
Oct 13, 2009
Sold by
Gmac Mortgage Llc
Bought by
Rebollo Luis A
Current Estimated Value
Purchase Details
Closed on
Apr 30, 2009
Sold by
Shabazz Omar and Gmac Mortgage Llc
Bought by
Gmac Mortgage Llc
Purchase Details
Closed on
Oct 4, 1999
Sold by
Longo Louis and Longo Anna M
Bought by
Shabazz Omar
Home Financials for this Owner
Home Financials are based on the most recent Mortgage that was taken out on this home.
Original Mortgage
$31,500
Interest Rate
7.85%
Mortgage Type
Purchase Money Mortgage
Create a Home Valuation Report for This Property
The Home Valuation Report is an in-depth analysis detailing your home's value as well as a comparison with similar homes in the area
Home Values in the Area
Average Home Value in this Area
Purchase History
| Date | Buyer | Sale Price | Title Company |
|---|---|---|---|
| Rebollo Luis A | $18,000 | -- | |
| Rebollo Luis A | $18,000 | -- | |
| Gmac Mortgage Llc | -- | -- | |
| Gmac Mortgage Llc | -- | -- | |
| Shabazz Omar | $35,000 | -- | |
| Shabazz Omar | $35,000 | -- |
Source: Public Records
Mortgage History
| Date | Status | Borrower | Loan Amount |
|---|---|---|---|
| Previous Owner | Shabazz Omar | $109,650 | |
| Previous Owner | Shabazz Omar | $31,500 |
Source: Public Records
Tax History
| Year | Tax Paid | Tax Assessment Tax Assessment Total Assessment is a certain percentage of the fair market value that is determined by local assessors to be the total taxable value of land and additions on the property. | Land | Improvement |
|---|---|---|---|---|
| 2025 | $5,869 | $130,480 | $12,740 | $117,740 |
| 2024 | $6,451 | $130,480 | $12,740 | $117,740 |
| 2023 | $7,071 | $130,480 | $12,740 | $117,740 |
| 2022 | $3,651 | $60,630 | $12,760 | $47,870 |
| 2021 | $3,651 | $60,630 | $12,760 | $47,870 |
| 2020 | $3,651 | $60,630 | $12,760 | $47,870 |
| 2019 | $3,651 | $60,630 | $12,760 | $47,870 |
| 2018 | $3,651 | $60,630 | $12,760 | $47,870 |
| 2017 | $3,924 | $65,180 | $12,750 | $52,430 |
| 2016 | $3,924 | $65,180 | $12,750 | $52,430 |
| 2015 | $3,795 | $65,180 | $12,750 | $52,430 |
| 2014 | $3,795 | $65,180 | $12,750 | $52,430 |
Source: Public Records
Map
Nearby Homes
Your Personal Tour Guide
Ask me questions while you tour the home.