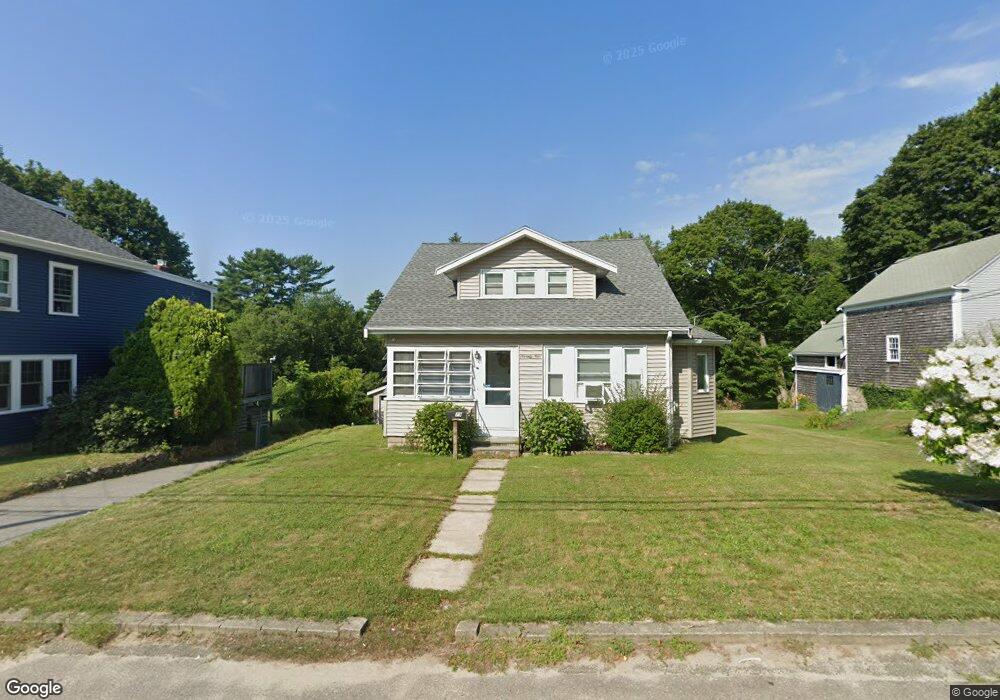
79 Gibbs Ave Wareham, MA 02571
Wareham Center NeighborhoodEstimated Value: $449,885 - $508,000
About This Home
This home is located at 79 Gibbs Ave, Wareham, MA 02571 and is currently estimated at $480,721, approximately $374 per square foot. 79 Gibbs Ave is a home located in Plymouth County with nearby schools including Tabor Academy.
Ownership History
We collect this data history from publicly available records. To have your information removed, we recommend requesting removal directly through your county’s website.
Purchase Details
Home Financials for this Owner
Home Financials are based on the most recent Mortgage that was taken out on this home.Home Values in the Area
Average Home Value in this Area
Purchase History
We collect this data history from publicly available records. To have your information removed, we recommend requesting removal directly through your county’s website.
| Date | Buyer | Sale Price | Title Company |
|---|---|---|---|
| $228,000 | -- | ||
| $228,000 | -- |
Mortgage History
We collect this data history from publicly available records. To have your information removed, we recommend requesting removal directly through your county’s website.
| Date | Status | Borrower | Loan Amount |
|---|---|---|---|
| Open | $227,000 | ||
| Closed | $227,000 |
Tax History
We collect this data history from publicly available records. To have your information removed, we recommend requesting removal directly through your county’s website.
| Year | Tax Paid | Tax Assessment Tax Assessment Total Assessment is a certain percentage of the fair market value that is determined by local assessors to be the total taxable value of land and additions on the property. | Land | Improvement |
|---|---|---|---|---|
| 2025 | $3,805 | $365,200 | $112,600 | $252,600 |
| 2024 | $3,893 | $346,700 | $87,300 | $259,400 |
| 2023 | $3,801 | $316,000 | $79,400 | $236,600 |
| 2022 | $3,490 | $264,800 | $79,400 | $185,400 |
| 2021 | $3,219 | $239,300 | $79,400 | $159,900 |
| 2020 | $3,084 | $232,600 | $79,400 | $153,200 |
| 2019 | $2,945 | $221,600 | $74,600 | $147,000 |
| 2018 | $2,727 | $200,100 | $74,600 | $125,500 |
| 2017 | $2,691 | $200,100 | $74,600 | $125,500 |
| 2016 | $2,484 | $183,600 | $71,500 | $112,100 |
| 2015 | $2,366 | $181,000 | $71,500 | $109,500 |
| 2014 | $2,449 | $190,600 | $71,500 | $119,100 |
Map
- 20 Dinahs Way
- 3 Rosemary Ln Unit A
- 21 Dinahs Way
- 66 Mayflower Ridge Dr
- 233 Marion Rd
- 2614 Cranberry Hwy
- 72 Main St
- 700 Main St
- 9 Rock Marsh Rd Unit B
- 9 Rock Marsh Rd Unit B
- 347 Marion Rd
- 45 Main St Unit 27
- 45 Main St Unit 112
- 45 Main St Unit 21
- 45 Main St Unit 217
- 45 Main St Unit 35
- 45 Main St Unit 37
- 2645 Cranberry Hwy Unit A
- 7 Indian Neck Rd
- 88 Hathaway St
- 35 Highland Rd
- 35 Highland Rd
- 64 Gibbs Ave
- 73 Gibbs Ave
- 31 Highland Rd
- 38 Highland Rd
- 71 Gibbs Ave
- 81 Gibbs Ave
- 85 Gibbs Ave
- 32 Highland Rd
- 29 Highland Rd
- 29 Highland Rd
- 78 Gibbs Ave
- 65 Gibbs Ave
- 67 Gibbs Ave
- 28 Highland Rd
- 23 Highland Rd
- 23 Highland Rd Unit 23
- 23 Highland Ave
- 23 Highland Rd Unit 23
Ask me questions while you tour the home.