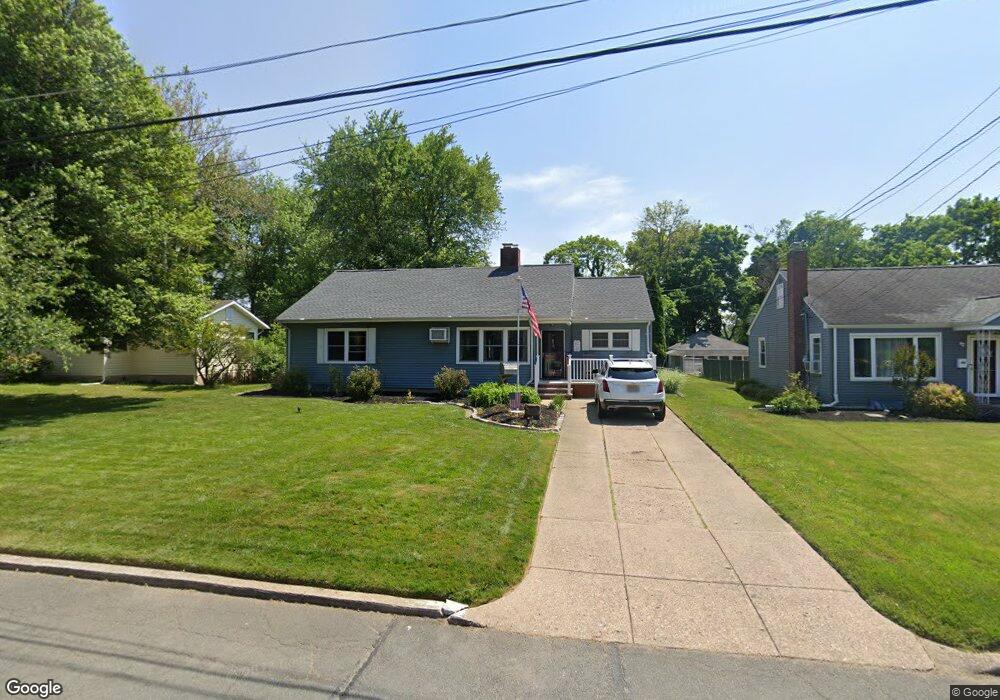
79 Main Blvd Ewing, NJ 08618
Ewing AreaEstimated Value: $397,000 - $539,000
About This Home
This home is located at 79 Main Blvd, Ewing, NJ 08618 and is currently estimated at $474,262, approximately $206 per square foot. 79 Main Blvd is a home located in Mercer County with nearby schools including Ewing High School, The Village Charter School, and Trenton Stem-To-Civics Charter School.
Ownership History
We collect this data history from publicly available records. To have your information removed, we recommend requesting removal directly through your county’s website.
Purchase Details
Purchase Details
Home Values in the Area
Average Home Value in this Area
Purchase History
We collect this data history from publicly available records. To have your information removed, we recommend requesting removal directly through your county’s website.
| Date | Buyer | Sale Price | Title Company |
|---|---|---|---|
| $135,000 | -- | ||
| $123,600 | -- |
Tax History
We collect this data history from publicly available records. To have your information removed, we recommend requesting removal directly through your county’s website.
| Year | Tax Paid | Tax Assessment Tax Assessment Total Assessment is a certain percentage of the fair market value that is determined by local assessors to be the total taxable value of land and additions on the property. | Land | Improvement |
|---|---|---|---|---|
| 2026 | $9,613 | $237,300 | $53,400 | $183,900 |
| 2025 | $9,613 | $237,300 | $53,400 | $183,900 |
| 2024 | $8,773 | $237,300 | $53,400 | $183,900 |
| 2023 | $8,773 | $237,300 | $53,400 | $183,900 |
| 2022 | $8,536 | $237,300 | $53,400 | $183,900 |
| 2021 | $8,327 | $237,300 | $53,400 | $183,900 |
| 2020 | $7,195 | $208,000 | $53,400 | $154,600 |
| 2019 | $7,008 | $208,000 | $53,400 | $154,600 |
| 2018 | $7,152 | $135,400 | $34,400 | $101,000 |
| 2017 | $7,318 | $135,400 | $34,400 | $101,000 |
| 2016 | $7,220 | $135,400 | $34,400 | $101,000 |
| 2015 | $7,123 | $135,400 | $34,400 | $101,000 |
| 2014 | $7,104 | $135,400 | $34,400 | $101,000 |
Map
- 1183 Lower Ferry Rd
- 84 Theresa St
- 41 Harding St
- 117 Beacon Ave
- 14 van Duyn Dr
- 56 Theresa St
- 21 Dixmont Ave
- 113 Rutledge Ave
- 33 Stratford Ave
- 1005 Terrace Blvd
- 1108 Lower Ferry Rd
- 20 Steinway Ave
- 60 Broad Ave
- 27 Walton Ave
- 86 Ridgewood Ave
- 107 Upper Ferry Rd
- 261 Upper Ferry Rd
- 38 Kyle Way
- 83 Kyle Way
- 121 Kyle Way
- 1218 Lower Ferry Rd
- 85 Main Blvd
- 83 Main Blvd
- 83 Main Blvd Unit A
- 1214 Lower Ferry Rd
- 81 Main Blvd
- 88 Lanning St
- 84 Main Blvd
- 1219 Lower Ferry Rd
- 1219 Lower Ferry Rd
- 86 Lanning St
- 1219 1225 Lower Ferry Rd
- 1210 Lower Ferry Rd
- 1230 Lower Ferry Rd
- 80 Main Blvd
- 84 Lanning St
- 1211 Lower Ferry Rd
- 77 Main Blvd
- 93 Lanning St
- 23 Conway Ave
Ask me questions while you tour the home.