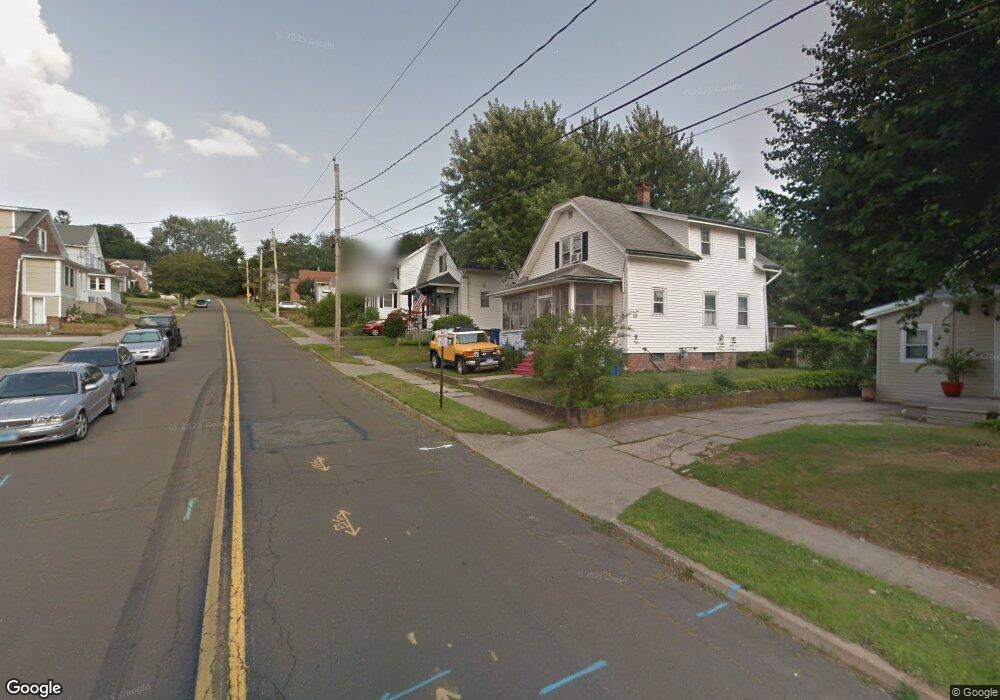
79 Wallace Row Wallingford, CT 06492
Estimated Value: $296,475 - $401,000
2
Beds
2
Baths
998
Sq Ft
$344/Sq Ft
Est. Value
About This Home
This home is located at 79 Wallace Row, Wallingford, CT 06492 and is currently estimated at $343,619, approximately $344 per square foot. 79 Wallace Row is a home located in New Haven County with nearby schools including Moses Y Beach Elementary School, Rock Hill Elementary School, and Dag Hammarskjold Middle School.
Ownership History
Date
Name
Owned For
Owner Type
Purchase Details
Closed on
Oct 31, 1997
Sold by
Malanych Jerry L
Bought by
Feingold Bruce and Feingold Barbara
Current Estimated Value
Home Financials for this Owner
Home Financials are based on the most recent Mortgage that was taken out on this home.
Original Mortgage
$98,100
Interest Rate
7.31%
Mortgage Type
Unknown
Purchase Details
Closed on
Jun 19, 1996
Sold by
Roberge Mary G and Buzinsky Christina
Bought by
Malanych Jerry L
Create a Home Valuation Report for This Property
The Home Valuation Report is an in-depth analysis detailing your home's value as well as a comparison with similar homes in the area
Home Values in the Area
Average Home Value in this Area
Purchase History
We collect this data history from publicly available records. To have your information removed, we recommend requesting removal directly through your county’s website.
| Date | Buyer | Sale Price | Title Company |
|---|---|---|---|
| Feingold Bruce | $99,000 | -- | |
| Feingold Bruce | $99,000 | -- | |
| Malanych Jerry L | $93,000 | -- | |
| Malanych Jerry L | $93,000 | -- |
Source: Public Records
Mortgage History
We collect this data history from publicly available records. To have your information removed, we recommend requesting removal directly through your county’s website.
| Date | Status | Borrower | Loan Amount |
|---|---|---|---|
| Open | Malanych Jerry L | $110,000 | |
| Closed | Malanych Jerry L | $125,000 | |
| Closed | Malanych Jerry L | $98,100 |
Source: Public Records
Tax History
| Year | Tax Paid | Tax Assessment Tax Assessment Total Assessment is a certain percentage of the fair market value that is determined by local assessors to be the total taxable value of land and additions on the property. | Land | Improvement |
|---|---|---|---|---|
| 2025 | $4,071 | $168,800 | $72,900 | $95,900 |
| 2024 | $3,572 | $116,500 | $60,800 | $55,700 |
| 2023 | $3,418 | $116,500 | $60,800 | $55,700 |
| 2022 | $3,383 | $116,500 | $60,800 | $55,700 |
| 2021 | $3,323 | $116,500 | $60,800 | $55,700 |
| 2020 | $3,459 | $118,500 | $65,000 | $53,500 |
| 2019 | $3,459 | $118,500 | $65,000 | $53,500 |
| 2018 | $3,394 | $118,500 | $65,000 | $53,500 |
| 2017 | $3,383 | $118,500 | $65,000 | $53,500 |
| 2016 | $3,305 | $118,500 | $65,000 | $53,500 |
| 2015 | $3,255 | $118,500 | $65,000 | $53,500 |
| 2014 | $3,186 | $118,500 | $65,000 | $53,500 |
Source: Public Records
Map
Nearby Homes
- 108 N Whittlesey Ave
- 36 3rd St
- 85 N Colony St
- 47 Spring St
- 61 Maple Ave
- 236 Hall Ave
- 42 S Cherry St Unit 307
- 40 S Cherry St Unit 18
- 54 Claremont Ave
- 44 Farm Hill Rd
- 47 Claremont Ave
- 74 Bull Ave
- 12 Briarwood Ln
- 5 Dell Ct
- 90 Masonic Ave
- 25 Clifton St
- 26 Beechwood Dr
- 23 West St
- 258 S Cherry St
- 2 Cannon Gateway
- 95 Wallace Row
- 103 Wallace Row
- 89 Wallace Row
- 85 Wallace Row
- 3 Vaz Place
- 105 Wallace Row
- 5 Vaz Place
- 1 Vaz Place
- 7 Vaz Place
- 96 Wallace Row
- 90 Wallace Row
- 73 Wallace Row
- 100 Wallace Row
- 84 Wallace Row
- 246 N Whittlesey Avenue Extension
- 246 N Whittlesey Ave
- 252 N Whittlesey Avenue Extension
- 238 N Whittlesey Avenue Extension
- 80 Wallace Row
- 104 Wallace Row
Your Personal Tour Guide
Ask me questions while you tour the home.