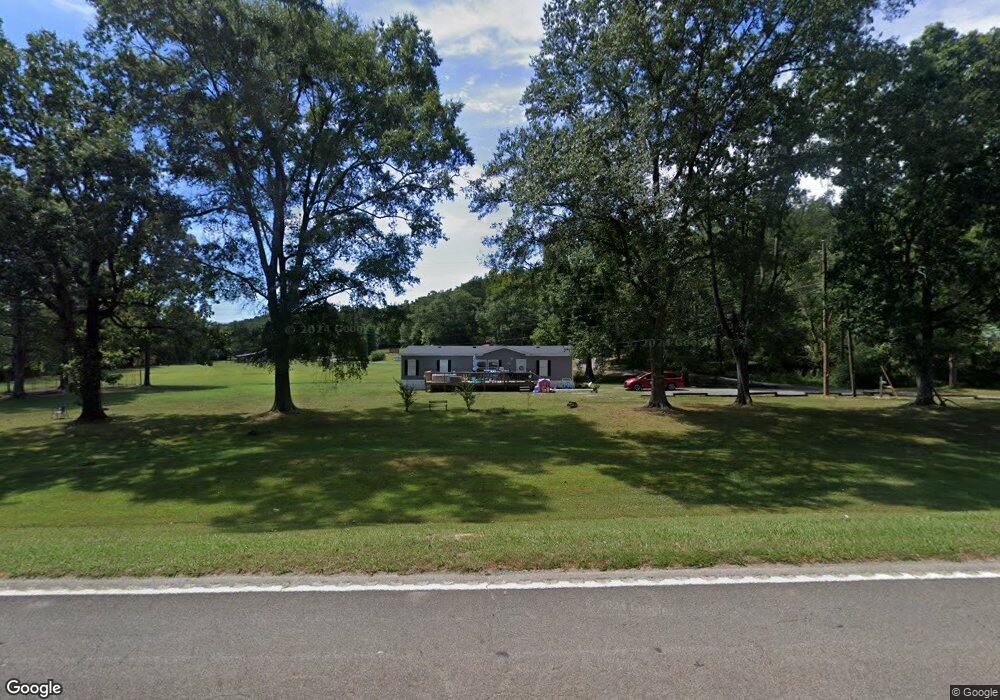
7907 Red Bud Rd NE Ranger, GA 30734
Estimated Value: $144,601 - $310,000
2
Beds
1
Bath
1,064
Sq Ft
$211/Sq Ft
Est. Value
About This Home
This home is located at 7907 Red Bud Rd NE, Ranger, GA 30734 and is currently estimated at $224,650, approximately $211 per square foot. 7907 Red Bud Rd NE is a home located in Gordon County with nearby schools including Fairmount Elementary School, Red Bud Middle School, and Sonoraville High School.
Ownership History
Date
Name
Owned For
Owner Type
Purchase Details
Closed on
Jan 1, 2003
Sold by
Tatum James S
Bought by
Owens Tammy T
Current Estimated Value
Create a Home Valuation Report for This Property
The Home Valuation Report is an in-depth analysis detailing your home's value as well as a comparison with similar homes in the area
Home Values in the Area
Average Home Value in this Area
Purchase History
| Date | Buyer | Sale Price | Title Company |
|---|---|---|---|
| Owens Tammy T | -- | -- |
Source: Public Records
Tax History
| Year | Tax Paid | Tax Assessment Tax Assessment Total Assessment is a certain percentage of the fair market value that is determined by local assessors to be the total taxable value of land and additions on the property. | Land | Improvement |
|---|---|---|---|---|
| 2025 | $719 | $32,400 | $4,320 | $28,080 |
| 2023 | $641 | $27,240 | $4,320 | $22,920 |
| 2022 | $645 | $25,880 | $4,320 | $21,560 |
| 2021 | $528 | $20,840 | $4,320 | $16,520 |
| 2020 | $537 | $20,760 | $4,320 | $16,440 |
| 2019 | $546 | $20,960 | $4,320 | $16,640 |
| 2018 | $512 | $19,760 | $4,320 | $15,440 |
| 2017 | $498 | $18,800 | $4,320 | $14,480 |
| 2016 | $499 | $18,800 | $4,320 | $14,480 |
| 2015 | $488 | $18,280 | $4,320 | $13,960 |
| 2014 | $459 | $17,753 | $4,329 | $13,424 |
Source: Public Records
Map
Nearby Homes
- 7946 Red Bud Rd NE
- 7596 Red Bud Rd NE
- 946 Hightower Loop Rd
- 0 Hightower Loop NE Unit 9628-D 20178374
- 191 Hightower Loop Rd
- 7169 Red Bud Rd NE
- 611 Pack Rd NE
- 0 Old Oakman Rd NE Unit 9628-A 20178369
- 0 T Johnson Rd NE Unit 9203-F
- 729 Taylor Town Rd NE
- 1021 Liberty Church Rd NE
- 1581 Taylor Town Rd NE
- 674 Archery Ct
- 137 Abe Ct
- 0 Highland Tree Ct Unit 10659516
- 0 Redbud Rd NE Unit 9625 20137379
- 0 Brookshire Rd Unit 26550642
- 0 Brookshire Rd Unit 10706211
- 0 Brookshire Rd Unit 428488
- 0 Brookshire Rd Unit 10706091
- 7899 Red Bud Rd NE
- 7921 Red Bud Rd NE
- 7959 Red Bud Rd NE
- 1274 Hightower Loop NE
- 7884 Red Bud Rd NE
- 7995 Red Bud Rd NE
- 1269 Hightower Loop NE
- 8025 Red Bud Rd NE
- 7868 Red Bud Rd NE
- 7820 Red Bud Rd NE
- 8041 Red Bud Rd NE
- 8020 Red Bud Rd NE
- 7715 Red Bud Rd NE
- 7794 Red Bud Rd NE
- 7952 Red Bud Rd NE
- 8056 Red Bud Rd NE
- 8082 Red Bud Rd NE
- 8016 Red Bud Rd NE
- 8086 Red Bud Rd NE
- 8014 Red Bud Rd NE
Your Personal Tour Guide
Ask me questions while you tour the home.