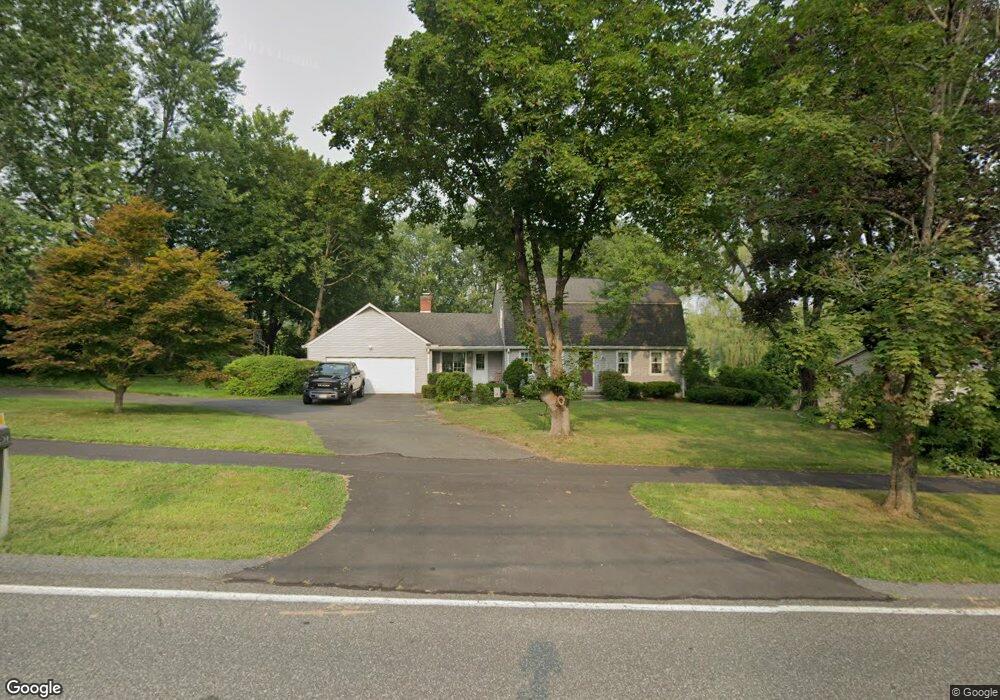
791 Main St Wilbraham, MA 01095
Estimated Value: $464,000 - $573,000
4
Beds
2
Baths
2,020
Sq Ft
$251/Sq Ft
Est. Value
About This Home
This home is located at 791 Main St, Wilbraham, MA 01095 and is currently estimated at $507,938, approximately $251 per square foot. 791 Main St is a home located in Hampden County with nearby schools including Minnechaug Regional High School and Wilbraham & Monson Academy.
Ownership History
Date
Name
Owned For
Owner Type
Purchase Details
Closed on
Nov 17, 2006
Sold by
Puckett Donna M and Holben Karen L
Bought by
Millot Christina W and Millot John L
Current Estimated Value
Home Financials for this Owner
Home Financials are based on the most recent Mortgage that was taken out on this home.
Original Mortgage
$219,920
Outstanding Balance
$130,960
Interest Rate
6.33%
Mortgage Type
Purchase Money Mortgage
Estimated Equity
$376,978
Create a Home Valuation Report for This Property
The Home Valuation Report is an in-depth analysis detailing your home's value as well as a comparison with similar homes in the area
Home Values in the Area
Average Home Value in this Area
Purchase History
We collect this data history from publicly available records. To have your information removed, we recommend requesting removal directly through your county’s website.
| Date | Buyer | Sale Price | Title Company |
|---|---|---|---|
| Millot Christina W | $274,900 | -- |
Source: Public Records
Mortgage History
We collect this data history from publicly available records. To have your information removed, we recommend requesting removal directly through your county’s website.
| Date | Status | Borrower | Loan Amount |
|---|---|---|---|
| Open | Millot Christina W | $219,920 | |
| Closed | Millot Christina W | $41,000 |
Source: Public Records
Tax History
| Year | Tax Paid | Tax Assessment Tax Assessment Total Assessment is a certain percentage of the fair market value that is determined by local assessors to be the total taxable value of land and additions on the property. | Land | Improvement |
|---|---|---|---|---|
| 2025 | $7,388 | $413,200 | $76,900 | $336,300 |
| 2024 | $7,470 | $403,800 | $76,900 | $326,900 |
| 2023 | $6,553 | $347,500 | $76,900 | $270,600 |
| 2022 | $6,553 | $319,800 | $76,900 | $242,900 |
| 2021 | $6,084 | $265,000 | $82,400 | $182,600 |
| 2020 | $5,931 | $265,000 | $82,400 | $182,600 |
| 2019 | $5,777 | $265,000 | $82,400 | $182,600 |
| 2018 | $5,757 | $254,300 | $82,400 | $171,900 |
| 2017 | $5,595 | $254,300 | $82,400 | $171,900 |
| 2016 | $5,227 | $242,000 | $91,400 | $150,600 |
| 2015 | $5,053 | $242,000 | $91,400 | $150,600 |
Source: Public Records
Map
Nearby Homes
- 9 Park Dr
- 230V Burleigh Rd
- 8 Bittersweet Ln
- 936 Stony Hill Rd
- 15 Ripley St
- 767 Stony Hill Rd
- 763 Stony Hill Rd
- 751 Ridge Rd
- 5 Hollow Rd
- 717-719 Stony Hill Rd
- 460 Soule Rd
- 7 Highridge Rd
- 545 Glendale Rd
- 95 Mountain Rd
- 10 Cadwell Dr
- 161 Raymond Dr
- 19 Overlook Dr
- 20 Arbor Ln
- 474 Mountain Rd
- 6 Brooklawn Rd
Your Personal Tour Guide
Ask me questions while you tour the home.