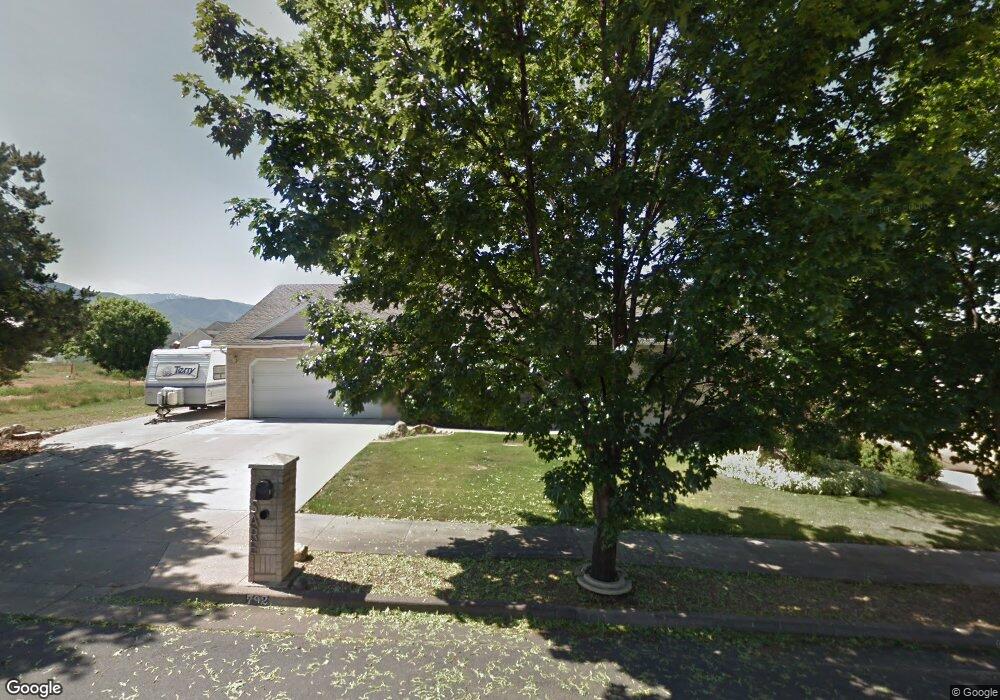
792 E 400 S Smithfield, UT 84335
Estimated Value: $509,000 - $548,000
4
Beds
3
Baths
3,216
Sq Ft
$166/Sq Ft
Est. Value
About This Home
This home is located at 792 E 400 S, Smithfield, UT 84335 and is currently estimated at $535,456, approximately $166 per square foot. 792 E 400 S is a home located in Cache County with nearby schools including Sunrise School, Cedar Ridge School, and North Cache Middle School.
Ownership History
Date
Name
Owned For
Owner Type
Purchase Details
Closed on
Apr 11, 2025
Sold by
Johns Jack E and Revocabl Candis
Bought by
Candis W Johns Residence Trust and Johns
Current Estimated Value
Purchase Details
Closed on
May 18, 2022
Sold by
Johns Jack E
Bought by
Jack E Johns And Candis W Johns Revocable Tru
Purchase Details
Closed on
Oct 26, 2021
Sold by
David S Lossle Construction Inc
Bought by
Johns Jack E and Johns Candis W
Purchase Details
Closed on
Feb 27, 2018
Sold by
Sare Robert D and Sare Mary Alice
Bought by
Johns Jack E and Johns Candis W
Create a Home Valuation Report for This Property
The Home Valuation Report is an in-depth analysis detailing your home's value as well as a comparison with similar homes in the area
Home Values in the Area
Average Home Value in this Area
Purchase History
| Date | Buyer | Sale Price | Title Company |
|---|---|---|---|
| Candis W Johns Residence Trust | -- | None Listed On Document | |
| Candis W Johns Residence Trust | -- | None Listed On Document | |
| Jack E Johns And Candis W Johns Revocable Tru | -- | None Listed On Document | |
| Johns Jack E | -- | None Available | |
| Johns Jack E | -- | Northearn Title |
Source: Public Records
Tax History
| Year | Tax Paid | Tax Assessment Tax Assessment Total Assessment is a certain percentage of the fair market value that is determined by local assessors to be the total taxable value of land and additions on the property. | Land | Improvement |
|---|---|---|---|---|
| 2025 | $2,276 | $304,660 | $0 | $0 |
| 2024 | $2,288 | $287,365 | $0 | $0 |
| 2023 | $2,395 | $284,475 | $0 | $0 |
| 2022 | $2,435 | $284,475 | $0 | $0 |
| 2021 | $2,401 | $428,585 | $74,000 | $354,585 |
| 2020 | $2,026 | $337,373 | $74,000 | $263,373 |
| 2019 | $2,031 | $322,373 | $59,000 | $263,373 |
| 2018 | $1,876 | $288,020 | $59,000 | $229,020 |
| 2017 | $1,752 | $146,960 | $0 | $0 |
| 2016 | $1,783 | $146,960 | $0 | $0 |
| 2015 | $1,457 | $119,565 | $0 | $0 |
| 2014 | $1,425 | $119,290 | $0 | $0 |
| 2013 | -- | $119,290 | $0 | $0 |
Source: Public Records
Map
Nearby Homes
- 127 S 830 E Unit 304
- 434 S Cardon Ridge Dr
- 442 S 455 E
- 1092 E 300 S
- 396 S 455 E
- 413 S 1150 E Unit 1101
- 641 S 1080 E Unit 44
- 577 S 1140 E Unit 1202
- 670 S 1080 E Unit 37
- 628 S 1080 E
- 12 S 1150 E Unit 8
- 722 S 1040 E Unit 21
- 738 S 1150 E Unit 9
- 776 S 1150 E
- 111 S 1250 E
- 641 S 380 E
- 2 S 1200 E Unit 15
- 13 N 1150 E
- 139 Fairway Dr
- 125 Fairway Dr
Your Personal Tour Guide
Ask me questions while you tour the home.