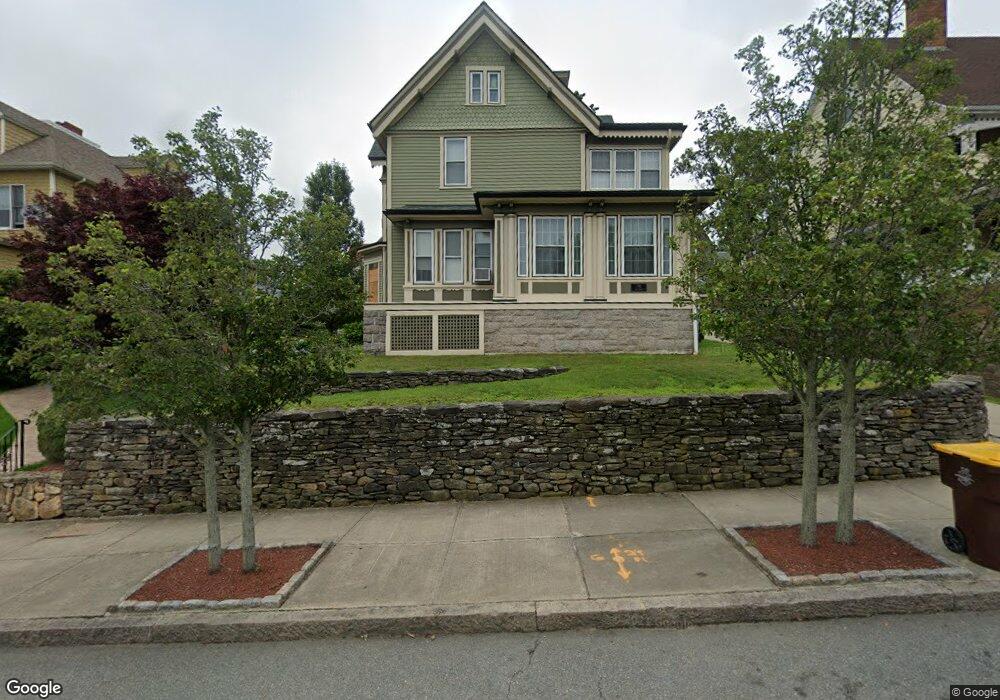
795 Rock St Fall River, MA 02720
Lower Highlands NeighborhoodEstimated Value: $428,000 - $633,000
About This Home
This home is located at 795 Rock St, Fall River, MA 02720 and is currently estimated at $505,544, approximately $172 per square foot. 795 Rock St is a home located in Bristol County with nearby schools including Mary Fonseca Elementary School, Morton Middle School, and B M C Durfee High School.
Ownership History
We collect this data history from publicly available records. To have your information removed, we recommend requesting removal directly through your county’s website.
Purchase Details
Purchase Details
Home Values in the Area
Average Home Value in this Area
Purchase History
We collect this data history from publicly available records. To have your information removed, we recommend requesting removal directly through your county’s website.
| Date | Buyer | Sale Price | Title Company |
|---|---|---|---|
| -- | -- | ||
| $40,000 | -- |
Mortgage History
We collect this data history from publicly available records. To have your information removed, we recommend requesting removal directly through your county’s website.
| Date | Status | Borrower | Loan Amount |
|---|---|---|---|
| Previous Owner | $48,000 | ||
| Previous Owner | $55,000 | ||
| Previous Owner | $60,000 | ||
| Previous Owner | $25,000 |
Tax History
We collect this data history from publicly available records. To have your information removed, we recommend requesting removal directly through your county’s website.
| Year | Tax Paid | Tax Assessment Tax Assessment Total Assessment is a certain percentage of the fair market value that is determined by local assessors to be the total taxable value of land and additions on the property. | Land | Improvement |
|---|---|---|---|---|
| 2025 | $4,744 | $414,300 | $118,600 | $295,700 |
| 2024 | $4,485 | $390,300 | $116,300 | $274,000 |
| 2023 | $4,664 | $380,100 | $104,800 | $275,300 |
| 2022 | $4,080 | $323,300 | $98,300 | $225,000 |
| 2021 | $4,002 | $289,400 | $93,900 | $195,500 |
| 2020 | $3,815 | $264,000 | $89,600 | $174,400 |
| 2019 | $3,816 | $261,700 | $93,600 | $168,100 |
| 2018 | $3,724 | $254,700 | $92,100 | $162,600 |
| 2017 | $3,529 | $252,100 | $92,100 | $160,000 |
| 2016 | $3,386 | $248,400 | $97,000 | $151,400 |
| 2015 | $3,252 | $248,600 | $97,000 | $151,600 |
| 2014 | $3,127 | $248,600 | $97,000 | $151,600 |
Map
- 724 High St
- 710 High St
- 216 Prospect St
- 604 Rock St
- 801 N Main St
- 68 Prospect St Unit 4 D
- 36 Mcclure Place
- 11 Dyer St
- 556 High St
- 613 Durfee St
- 485 Rock St
- 434 Linden St Unit 2
- 434 Linden St Unit 4
- 630 Maple St
- 750 Davol St Unit 321
- 750 Davol St Unit 519
- 750 Davol St Unit 318
- 195 Brownell St
- 47 Summerfield St
- 364 High St
Ask me questions while you tour the home.