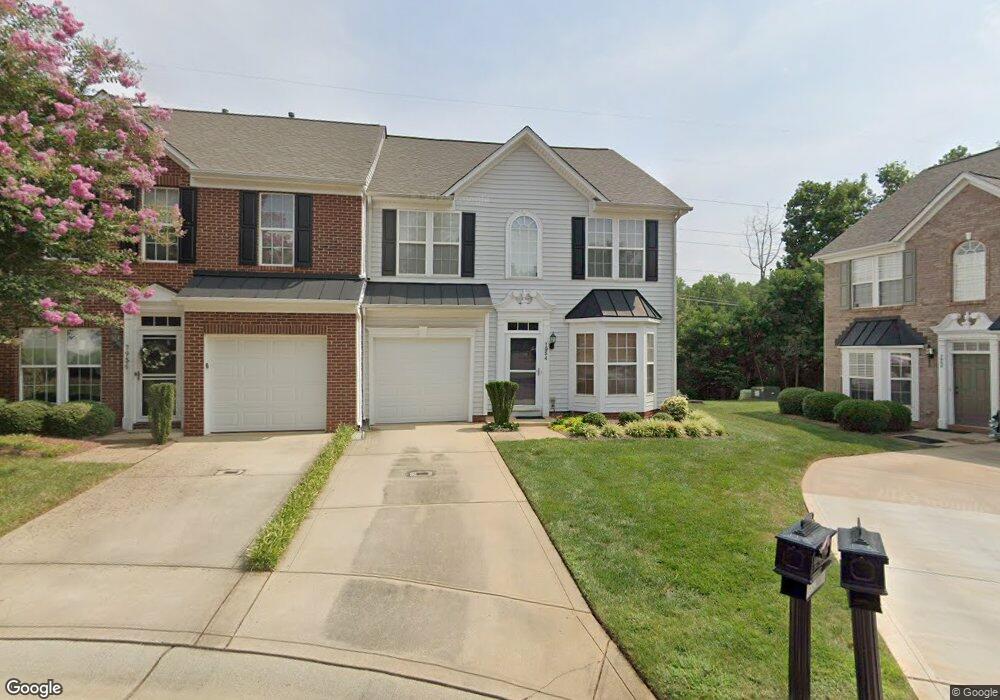
7954 Mariners Pointe Cir Denver, NC 28037
Estimated Value: $290,006 - $315,000
3
Beds
3
Baths
1,666
Sq Ft
$183/Sq Ft
Est. Value
About This Home
This home is located at 7954 Mariners Pointe Cir, Denver, NC 28037 and is currently estimated at $304,502, approximately $182 per square foot. 7954 Mariners Pointe Cir is a home located in Lincoln County with nearby schools including St. James Elementary School, East Lincoln Middle School, and East Lincoln High School.
Ownership History
Date
Name
Owned For
Owner Type
Purchase Details
Closed on
Aug 4, 2008
Sold by
Bouttamy Katay C and Bouttamy Amanda
Bought by
Sisko David and Sisko Kimberly Keith
Current Estimated Value
Home Financials for this Owner
Home Financials are based on the most recent Mortgage that was taken out on this home.
Original Mortgage
$123,200
Outstanding Balance
$80,780
Interest Rate
6.31%
Mortgage Type
Purchase Money Mortgage
Estimated Equity
$223,722
Purchase Details
Closed on
Jun 13, 2006
Sold by
Lundgren Lori
Bought by
Bouttamy Katay C
Home Financials for this Owner
Home Financials are based on the most recent Mortgage that was taken out on this home.
Original Mortgage
$126,400
Interest Rate
6.51%
Mortgage Type
New Conventional
Purchase Details
Closed on
Oct 21, 2002
Bought by
Lundgren Lori
Purchase Details
Closed on
Jun 10, 2002
Bought by
Nvr Inc
Create a Home Valuation Report for This Property
The Home Valuation Report is an in-depth analysis detailing your home's value as well as a comparison with similar homes in the area
Purchase History
We collect this data history from publicly available records. To have your information removed, we recommend requesting removal directly through your county’s website.
| Date | Buyer | Sale Price | Title Company |
|---|---|---|---|
| Sisko David | $154,000 | None Available | |
| Bouttamy Katay C | $158,000 | None Available | |
| Lundgren Lori | $144,000 | -- | |
| Nvr Inc | $119,000 | -- |
Source: Public Records
Mortgage History
We collect this data history from publicly available records. To have your information removed, we recommend requesting removal directly through your county’s website.
| Date | Status | Borrower | Loan Amount |
|---|---|---|---|
| Open | Sisko David | $123,200 | |
| Previous Owner | Bouttamy Katay C | $126,400 |
Source: Public Records
Tax History
| Year | Tax Paid | Tax Assessment Tax Assessment Total Assessment is a certain percentage of the fair market value that is determined by local assessors to be the total taxable value of land and additions on the property. | Land | Improvement |
|---|---|---|---|---|
| 2025 | $1,978 | $304,372 | $37,000 | $267,372 |
| 2024 | $1,951 | $304,372 | $37,000 | $267,372 |
| 2023 | $1,946 | $304,372 | $37,000 | $267,372 |
| 2022 | $1,434 | $178,426 | $30,000 | $148,426 |
| 2021 | $1,442 | $178,426 | $30,000 | $148,426 |
| 2020 | $1,244 | $178,426 | $30,000 | $148,426 |
| 2019 | $1,244 | $178,426 | $30,000 | $148,426 |
| 2018 | $1,148 | $149,512 | $23,500 | $126,012 |
| 2017 | $1,047 | $149,512 | $23,500 | $126,012 |
| 2016 | $1,042 | $149,512 | $23,500 | $126,012 |
| 2015 | $1,153 | $149,512 | $23,500 | $126,012 |
| 2014 | $1,138 | $153,888 | $20,000 | $133,888 |
Source: Public Records
Map
Nearby Homes
- 7142 Mariners Village Dr
- 2440 Mariners Cove Ln
- 7958 Unity Church Rd
- 2344 Smith Cove Rd
- 2360 Smith Harbour Dr
- 7934 Harbor Ridge Ct
- 7380 Latham Way
- 2078 Rock Springs Cir
- 1982 Ambrose Way
- 7162 Indigo Way
- 2325 Perry Rd
- 2474 Green Point Ln
- 2008 Rock Springs Cir
- 1758 Newland Rd
- 1959 Rock Springs Cir
- 7982 King Arthurs Ct
- 7224 Caley St
- 7219 Ogden Place
- 2496 Lake Shore Rd S
- 7208 Ogden Place
- 7950 Mariners Pointe Cir
- 7950 Mariners Pointe Cir Unit 5A
- 7946 Mariners Pointe Cir
- 7954 Mariners Pointe Cir Unit One
- 7944 Mariners Pointe Cir
- 7944 Mariners Pointe Cir Unit D
- 7944 Mariners Pointe Cir Unit 24
- 7956 Mariners Pointe Cir
- 7942 Mariners Pointe Cir
- 7942 Mariners Pointe Cir Unit 5C
- 7958 Mariners Pointe Cir
- 7940 Mariners Pointe Cir
- 7940 Mariners Pointe Cir Unit F
- 7947 Mariners Pointe Cir
- 7960 Mariners Pointe Cir
- 7943 Mariners Pointe Cir Unit 79
- 7962 Mariners Pointe Cir
- 7941 Mariners Pointe Cir
- 7938 Mariners Pointe Cir
- 7938 Mariners Pointe Cir Unit 21
Your Personal Tour Guide
Ask me questions while you tour the home.