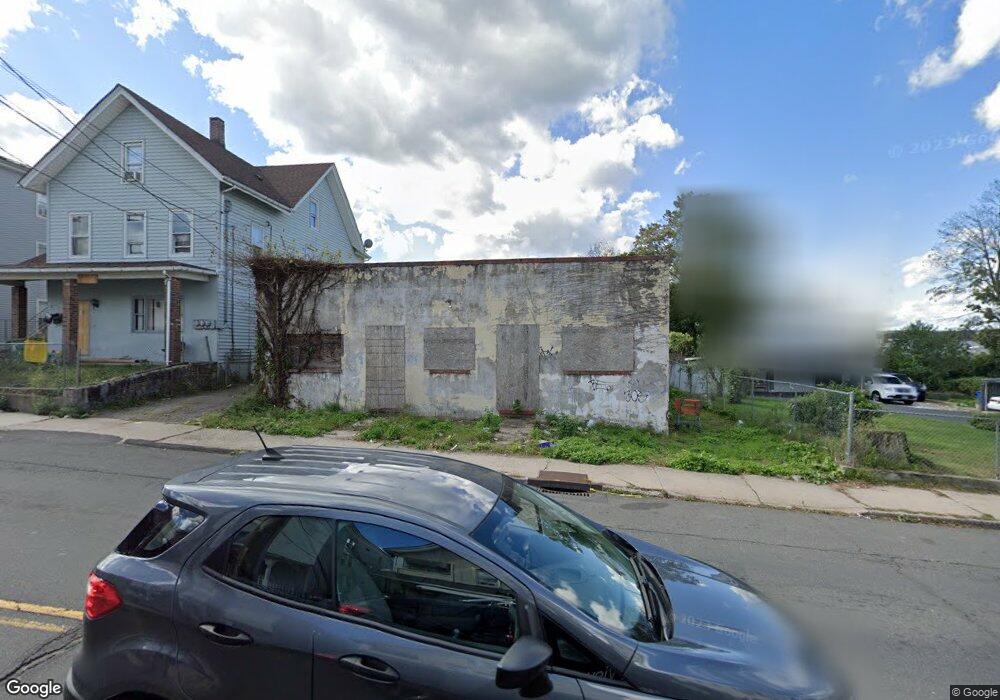
798 Baldwin St Waterbury, CT 06706
South End District NeighborhoodEstimated Value: $64,523
About This Home
This home is located at 798 Baldwin St, Waterbury, CT 06706 and is currently estimated at $64,523, approximately $26 per square foot. 798 Baldwin St is a home located in New Haven County with nearby schools including Washington School, West Side Middle School, and John F. Kennedy High School.
Ownership History
We collect this data history from publicly available records. To have your information removed, we recommend requesting removal directly through your county’s website.
Purchase Details
Purchase Details
Purchase Details
Purchase Details
Home Values in the Area
Average Home Value in this Area
Purchase History
We collect this data history from publicly available records. To have your information removed, we recommend requesting removal directly through your county’s website.
| Date | Buyer | Sale Price | Title Company |
|---|---|---|---|
| -- | -- | ||
| $15,000 | -- | ||
| $41,000 | -- | ||
| $19,000 | -- |
Tax History
We collect this data history from publicly available records. To have your information removed, we recommend requesting removal directly through your county’s website.
| Year | Tax Paid | Tax Assessment Tax Assessment Total Assessment is a certain percentage of the fair market value that is determined by local assessors to be the total taxable value of land and additions on the property. | Land | Improvement |
|---|---|---|---|---|
| 2025 | $1,899 | $42,210 | $18,970 | $23,240 |
| 2024 | $2,087 | $42,210 | $18,970 | $23,240 |
| 2023 | $2,287 | $42,210 | $18,970 | $23,240 |
| 2022 | $2,149 | $35,700 | $18,950 | $16,750 |
| 2021 | $2,149 | $35,700 | $18,950 | $16,750 |
| 2020 | $2,149 | $35,700 | $18,950 | $16,750 |
| 2019 | $2,149 | $35,700 | $18,950 | $16,750 |
| 2018 | $2,149 | $35,700 | $18,950 | $16,750 |
| 2017 | $2,149 | $35,700 | $18,950 | $16,750 |
| 2016 | $2,149 | $35,700 | $18,950 | $16,750 |
| 2015 | $2,078 | $35,700 | $18,950 | $16,750 |
| 2014 | $2,078 | $35,700 | $18,950 | $16,750 |
Map
- 720 Baldwin St
- 37 Southview St
- 121 Lounsbury St
- 222 Lounsbury St
- 915 S Main St
- 106 Laval St
- 336 Sylvan Ave
- 701 S Main St
- 11 Bergen St
- 110 Middle St
- 265 Piedmont St
- 109 Edgewood Ave
- 0372 Floyd St
- 41L Floyd St
- 0039 Floyd St
- 18 Greenmount Terrace
- 33 Congress Ave
- 48 Temple St
- 38 Green St
- 354 Edgewood Ave
- 790 Baldwin St
- 780 Baldwin St
- 780 Baldwin St Unit 2FL
- 780 Baldwin St Unit 1 FL
- 65 South St
- 805 Baldwin St
- 816 Baldwin St
- 781 Baldwin St
- 75 South St
- 75 South St Unit 2nd
- 811 Baldwin St
- 818 Baldwin St
- 818 Baldwin St Unit 3FL
- 818 Baldwin St Unit 2nd FL
- 791 Baldwin St
- 763 Baldwin St
- 79 South St
- 750 Baldwin St
- 826 Baldwin St
- 757 Baldwin St
Ask me questions while you tour the home.