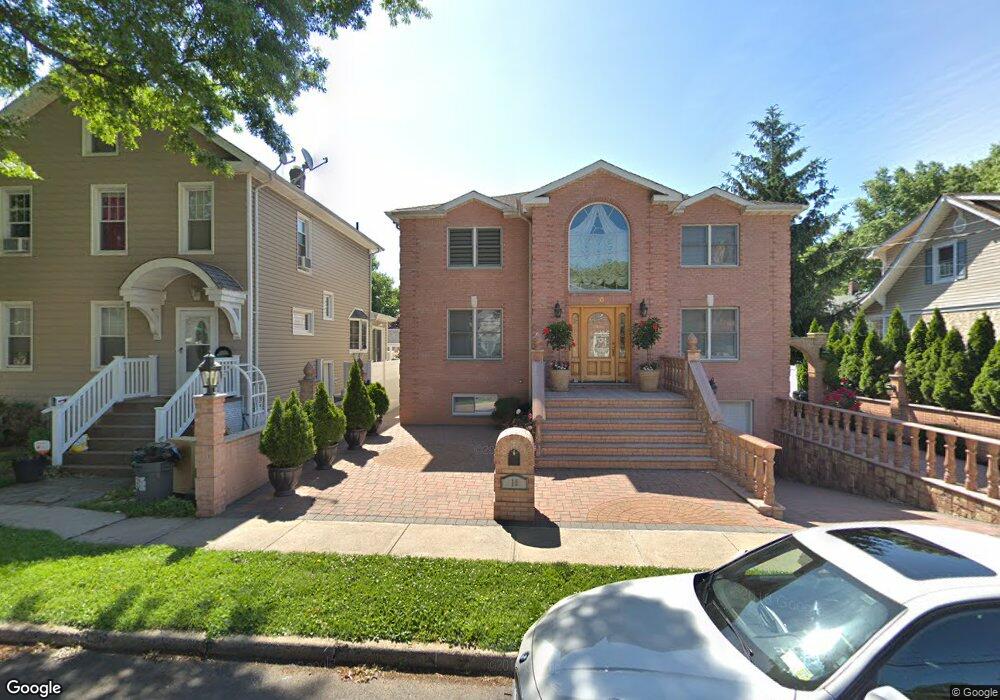
8 3rd St Staten Island, NY 10306
New Dorp NeighborhoodEstimated Value: $811,000 - $1,188,000
4
Beds
4
Baths
3,300
Sq Ft
$317/Sq Ft
Est. Value
About This Home
This home is located at 8 3rd St, Staten Island, NY 10306 and is currently estimated at $1,046,998, approximately $317 per square foot. 8 3rd St is a home located in Richmond County with nearby schools including P.S. 41 The Stephanie a Vierno School, Is 2 George L Egbert, and New Dorp High School.
Ownership History
Date
Name
Owned For
Owner Type
Purchase Details
Closed on
Mar 23, 2005
Sold by
Block 2898 Building Corp
Bought by
Sula Becir and Sula Aise
Current Estimated Value
Home Financials for this Owner
Home Financials are based on the most recent Mortgage that was taken out on this home.
Original Mortgage
$450,000
Interest Rate
5.95%
Mortgage Type
Fannie Mae Freddie Mac
Purchase Details
Closed on
Feb 11, 2004
Sold by
Sherwood Julia C and Estate Of Julia C Haley
Bought by
Block 2898 Building Corp
Create a Home Valuation Report for This Property
The Home Valuation Report is an in-depth analysis detailing your home's value as well as a comparison with similar homes in the area
Home Values in the Area
Average Home Value in this Area
Purchase History
| Date | Buyer | Sale Price | Title Company |
|---|---|---|---|
| Sula Becir | $793,216 | -- | |
| Block 2898 Building Corp | $340,000 | -- |
Source: Public Records
Mortgage History
| Date | Status | Borrower | Loan Amount |
|---|---|---|---|
| Previous Owner | Sula Becir | $450,000 |
Source: Public Records
Tax History
| Year | Tax Paid | Tax Assessment Tax Assessment Total Assessment is a certain percentage of the fair market value that is determined by local assessors to be the total taxable value of land and additions on the property. | Land | Improvement |
|---|---|---|---|---|
| 2025 | $11,367 | $61,080 | $14,551 | $46,529 |
| 2024 | $11,367 | $65,220 | $13,224 | $51,996 |
| 2023 | $11,350 | $55,887 | $12,290 | $43,597 |
| 2022 | $10,525 | $57,180 | $15,240 | $41,940 |
| 2021 | $10,468 | $49,740 | $15,240 | $34,500 |
| 2020 | $10,287 | $48,600 | $15,240 | $33,360 |
| 2019 | $9,865 | $50,340 | $15,240 | $35,100 |
| 2018 | $9,614 | $47,160 | $14,843 | $32,317 |
| 2017 | $9,088 | $44,580 | $15,240 | $29,340 |
| 2016 | $8,827 | $44,157 | $15,095 | $29,062 |
| 2015 | $7,542 | $41,658 | $11,854 | $29,804 |
| 2014 | $7,542 | $39,300 | $12,720 | $26,580 |
Source: Public Records
Map
Nearby Homes
- 22 Otis Ave
- 3 3rd St
- 12 Altamont St
- 109 Saint Stephens Place
- 79 Cloister Place
- 2419 Richmond Rd
- 78 Cloister Place
- 155 Burbank Ave
- 19 1st St
- 168 Otis Ave
- 24 Saint Stephens Place
- 14 Walnut Place
- 123 Prescott Ave
- 93 Beacon Ave
- 80 1st St
- 1197 Todt Hill Rd
- 118 Jacques Ave
- 257 Locust Ave
- 67 Colfax Ave
- 109 8th St
Your Personal Tour Guide
Ask me questions while you tour the home.