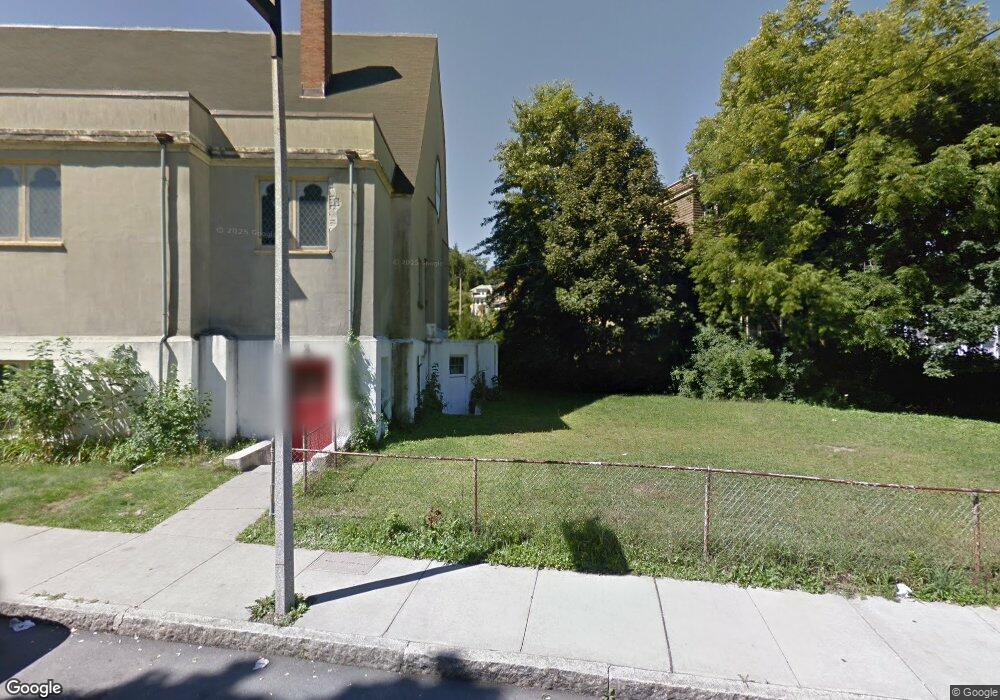
8 Argyle St Boston, MA 02124
Saint Marks NeighborhoodEstimated Value: $2,045,119
Studio
--
Bath
50,000
Sq Ft
$41/Sq Ft
Est. Value
About This Home
This home is located at 8 Argyle St, Boston, MA 02124 and is currently priced at $2,045,119, approximately $40 per square foot. 8 Argyle St is a home located in Suffolk County with nearby schools including Codman Academy Charter Public School and Epiphany School.
Ownership History
Date
Name
Owned For
Owner Type
Purchase Details
Closed on
Jul 30, 2018
Sold by
Synod New
Bought by
500 Talbot Llc
Current Estimated Value
Home Financials for this Owner
Home Financials are based on the most recent Mortgage that was taken out on this home.
Original Mortgage
$400,000
Outstanding Balance
$343,072
Interest Rate
4.6%
Mortgage Type
New Conventional
Purchase Details
Closed on
Jul 27, 2018
Sold by
Our Saviours Evangelic
Bought by
Evan New
Home Financials for this Owner
Home Financials are based on the most recent Mortgage that was taken out on this home.
Original Mortgage
$400,000
Outstanding Balance
$343,072
Interest Rate
4.6%
Mortgage Type
New Conventional
Create a Home Valuation Report for This Property
The Home Valuation Report is an in-depth analysis detailing your home's value as well as a comparison with similar homes in the area
Home Values in the Area
Average Home Value in this Area
Purchase History
| Date | Buyer | Sale Price | Title Company |
|---|---|---|---|
| 500 Talbot Llc | $1,325,000 | -- | |
| 500 Talbot Llc | $1,325,000 | -- | |
| Evan New | -- | -- | |
| New England Synod Evan | -- | -- |
Source: Public Records
Mortgage History
| Date | Status | Borrower | Loan Amount |
|---|---|---|---|
| Open | 500 Talbot Llc | $400,000 | |
| Closed | 500 Talbot Llc | $400,000 |
Source: Public Records
Tax History
| Year | Tax Paid | Tax Assessment Tax Assessment Total Assessment is a certain percentage of the fair market value that is determined by local assessors to be the total taxable value of land and additions on the property. | Land | Improvement |
|---|---|---|---|---|
| 2025 | $31,102 | $3,362,000 | $1,538,500 | $1,823,500 |
| 2024 | $31,102 | $1,230,800 | $1,230,800 | $0 |
| 2023 | $30,376 | $1,230,800 | $1,230,800 | $0 |
| 2022 | $30,745 | $1,230,800 | $1,230,800 | $0 |
| 2021 | $0 | $1,410,600 | $496,400 | $914,200 |
| 2020 | $35,152 | $1,410,600 | $496,400 | $914,200 |
| 2019 | $0 | $1,257,200 | $499,100 | $758,100 |
| 2018 | $0 | $1,185,100 | $484,500 | $700,600 |
| 2017 | $0 | $1,121,700 | $455,100 | $666,600 |
| 2016 | -- | $1,006,300 | $426,000 | $580,300 |
| 2015 | -- | $927,600 | $381,800 | $545,800 |
| 2014 | -- | $853,600 | $338,100 | $515,500 |
Source: Public Records
Map
Nearby Homes
- 18 Santuit St
- 9 Edwin St
- 9 Wrentham St Unit n/a
- 123-125 Centre St Unit TH4
- 123-125 Centre St Unit TH 6
- 138 Centre St Unit 3
- 567 Talbot Ave Unit 20
- 170 Ashmont St Unit 15
- 30 Welles Ave Unit 3
- 84 Bailey St
- 72 Bailey St
- 87 Bailey St Unit 2
- 58 Bailey St
- 3 Roslin St Unit 2
- 61 Lyndhurst St Unit 2
- 80 Florida St Unit 12
- 48 Bailey St Unit 1
- 14 Torrey St Unit 1
- 52 Withington St Unit 7
- 86 Lonsdale St
- 500 Talbot Ave Unit 311
- 500 Talbot Ave Unit 102
- 500 Talbot Ave Unit 308
- 500 Talbot Ave Unit 313
- 500 Talbot Ave Unit 410
- 500 Talbot Ave Unit 402
- 500 Talbot Ave Unit 401
- 500 Talbot Ave
- 500 Talbot Ave Unit 406
- 500 Talbot Ave Unit 404
- 474 Talbot Ave
- 474 Talbot Ave Unit 3
- 15 Argyle St
- 15 Argyle St Unit 7
- 79 Argyle St
- 17 Argyle St
- 17 Argyle St Unit 3
- 17 Argyle St Unit 2
- 17 Argyle St Unit 1
- 18 Argyle St
Your Personal Tour Guide
Ask me questions while you tour the home.