8 Beach Ave Bourne, MA 02532
Monument Beach NeighborhoodEstimated Value: $427,000 - $562,000
About This Home
This home is located at 8 Beach Ave, Bourne, MA 02532 and is currently estimated at $461,628, approximately $769 per square foot. 8 Beach Ave is a home located in Barnstable County with nearby schools including Bourne High School, St Margaret Regional School, and Cadence Academy Preschool - Bourne.
Ownership History
We collect this data history from publicly available records. To have your information removed, we recommend requesting removal directly through your county’s website.
Purchase Details
Purchase Details
Purchase Details
Purchase Details
Home Values in the Area
Average Home Value in this Area
Purchase History
We collect this data history from publicly available records. To have your information removed, we recommend requesting removal directly through your county’s website.
| Date | Buyer | Sale Price | Title Company |
|---|---|---|---|
| -- | -- | ||
| $77,000 | -- | ||
| $180,000 | -- | ||
| $83,500 | -- |
Mortgage History
We collect this data history from publicly available records. To have your information removed, we recommend requesting removal directly through your county’s website.
| Date | Status | Borrower | Loan Amount |
|---|---|---|---|
| Previous Owner | $198,000 | ||
| Closed | $183,000 |
Tax History
We collect this data history from publicly available records. To have your information removed, we recommend requesting removal directly through your county’s website.
| Year | Tax Paid | Tax Assessment Tax Assessment Total Assessment is a certain percentage of the fair market value that is determined by local assessors to be the total taxable value of land and additions on the property. | Land | Improvement |
|---|---|---|---|---|
| 2025 | $2,892 | $370,300 | $206,400 | $163,900 |
| 2024 | $2,827 | $352,500 | $196,500 | $156,000 |
| 2023 | $2,749 | $312,000 | $173,900 | $138,100 |
| 2022 | $2,659 | $263,500 | $153,900 | $109,600 |
| 2021 | $4,737 | $239,800 | $140,100 | $99,700 |
| 2020 | $2,554 | $237,800 | $138,700 | $99,100 |
| 2019 | $4,249 | $220,200 | $126,700 | $93,500 |
| 2018 | $2,187 | $209,800 | $120,700 | $89,100 |
| 2017 | $1,758 | $207,700 | $119,500 | $88,200 |
| 2016 | $2,069 | $203,600 | $119,500 | $84,100 |
| 2015 | $2,050 | $203,600 | $119,500 | $84,100 |
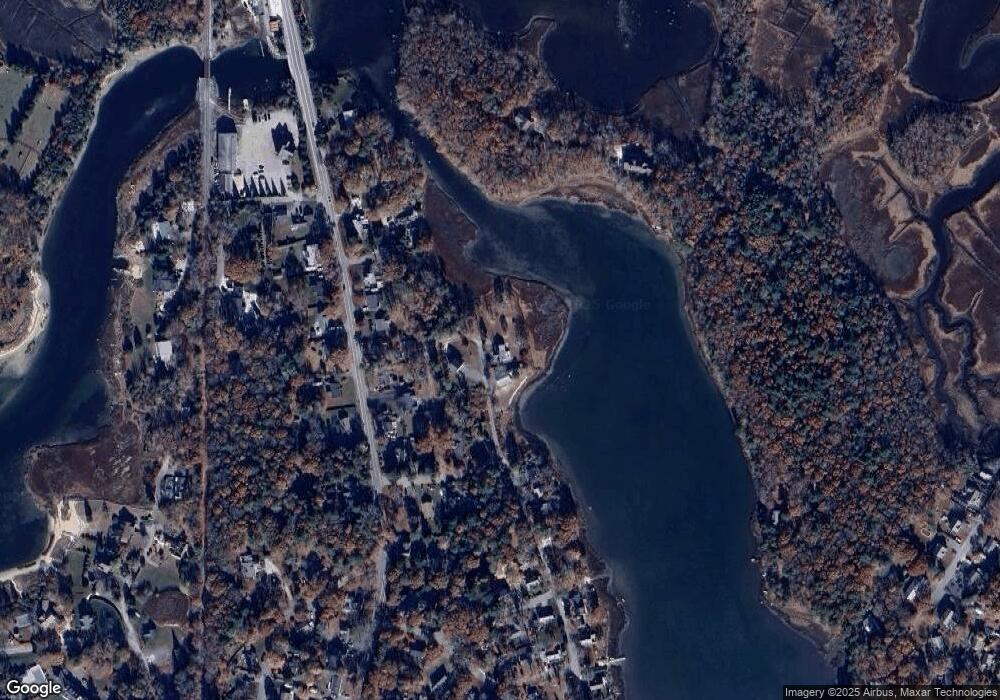
Map
- 443 Shore Rd
- 455 Shore Rd
- 455 Shore Rd
- 8 Sherry Ln
- 8 Sherry Ln
- 47 Cliff Rd
- 47 Cliff Rd
- 566 Shore Rd
- 10 Roundhouse Rd Unit 10
- 65 Roundhouse Rd Unit 65
- 34 Roundhouse Rd Unit 34
- 35 Benedict Rd
- 15 Eldridge St
- 30 Seabreeze Dr
- 22 Presidents Rd
- 4 Cross Rd
- 16 Amberwood Ct
- 2 Candleberry Ct Unit 2
- 2 Amberwood Ct Unit 2
- 2 Amberwood Ct Unit 2
Ask me questions while you tour the home.