8 Chase St Bellingham, MA 02019
Estimated Value: $553,475 - $647,000
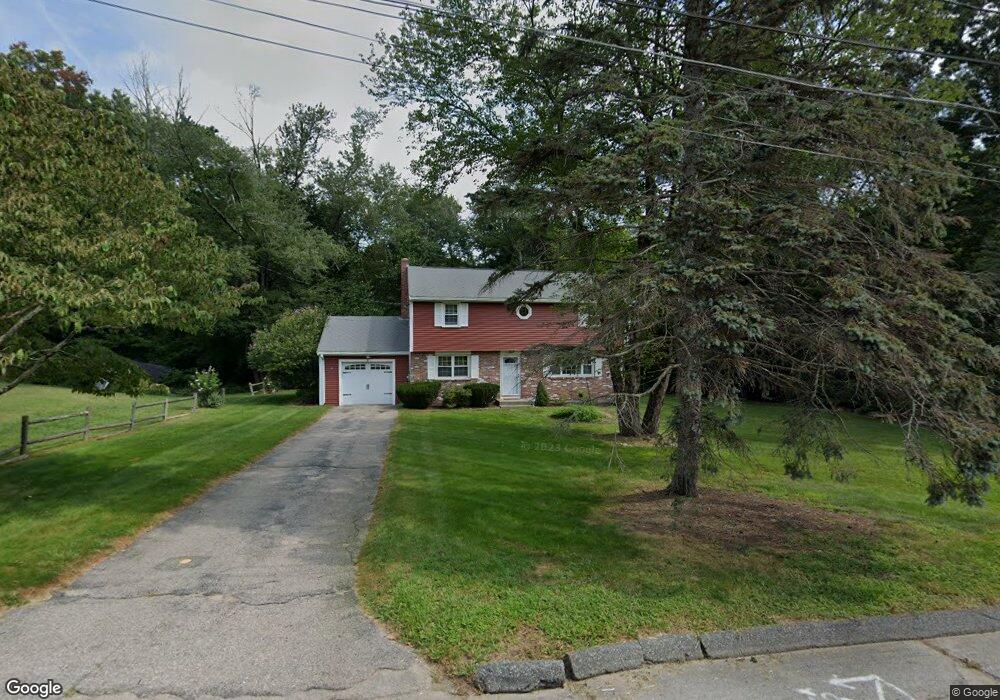
About This Home
This home is located at 8 Chase St, Bellingham, MA 02019 and is currently estimated at $592,369, approximately $329 per square foot. 8 Chase St is a home located in Norfolk County with nearby schools including Stall Brook Elementary School, Bellingham High School, and Bethany Christian Academy.
Ownership History
We collect this data history from publicly available records. To have your information removed, we recommend requesting removal directly through your county’s website.
Purchase Details
Home Financials for this Owner
Home Financials are based on the most recent Mortgage that was taken out on this home.Purchase Details
Purchase Details
Purchase Details
Home Values in the Area
Average Home Value in this Area
Purchase History
We collect this data history from publicly available records. To have your information removed, we recommend requesting removal directly through your county’s website.
| Date | Buyer | Sale Price | Title Company |
|---|---|---|---|
| $187,000 | -- | ||
| $187,000 | -- | ||
| $136,200 | -- | ||
| $136,200 | -- | ||
| $148,000 | -- | ||
| $148,000 | -- | ||
| $154,000 | -- |
Mortgage History
We collect this data history from publicly available records. To have your information removed, we recommend requesting removal directly through your county’s website.
| Date | Status | Borrower | Loan Amount |
|---|---|---|---|
| Open | $112,000 | ||
| Closed | $112,000 |
Tax History
We collect this data history from publicly available records. To have your information removed, we recommend requesting removal directly through your county’s website.
| Year | Tax Paid | Tax Assessment Tax Assessment Total Assessment is a certain percentage of the fair market value that is determined by local assessors to be the total taxable value of land and additions on the property. | Land | Improvement |
|---|---|---|---|---|
| 2025 | $5,433 | $432,600 | $169,300 | $263,300 |
| 2024 | $5,211 | $405,200 | $154,600 | $250,600 |
| 2023 | $5,023 | $384,900 | $147,200 | $237,700 |
| 2022 | $4,913 | $348,900 | $122,700 | $226,200 |
| 2021 | $4,774 | $331,300 | $122,700 | $208,600 |
| 2020 | $4,550 | $320,000 | $122,700 | $197,300 |
| 2019 | $4,459 | $313,800 | $122,700 | $191,100 |
| 2018 | $4,201 | $291,500 | $118,000 | $173,500 |
| 2017 | $4,087 | $285,000 | $118,000 | $167,000 |
| 2016 | $3,897 | $272,700 | $116,000 | $156,700 |
| 2015 | $3,738 | $262,300 | $111,600 | $150,700 |
| 2014 | $3,751 | $255,900 | $109,000 | $146,900 |
Map
- 455 Hartford Ave
- 121 Twin Brook Ln
- 32 Arapahoe Rd
- 85 Pine St
- 252 Main St
- 394 Village St
- 44 Granite St
- 1 Castle Rd
- 23 Williamsburg Way Unit 23
- 224 Main St
- 35 Milford St
- 3 Harmony Way Unit 3
- 50 Milford St
- 6 Haverstock Rd
- 46 Phillip Dr
- 12 Alder St
- 199 Main St
- 328 Village St Unit 328
- 8 Donato Dr
- 33 Lincoln St
- 12 Chase St
- 4 Chase St
- 7 Chase St
- 15 Chase St
- 11 Chase St
- 433 Hartford Ave
- 437 Hartford Ave
- 439 Hartford Ave
- 429 Hartford Ave
- 76 Standish Rd
- 80 Standish Rd
- 425 Hartford Ave
- 441 Hartford Ave
- 72 Standish Rd
- 68 Standish Rd
- 434 Hartford Ave
- 434 Hartford Ave Unit 1
- 436 Hartford Ave
- 426 Hartford Ave
- 421 Hartford Ave
Ask me questions while you tour the home.