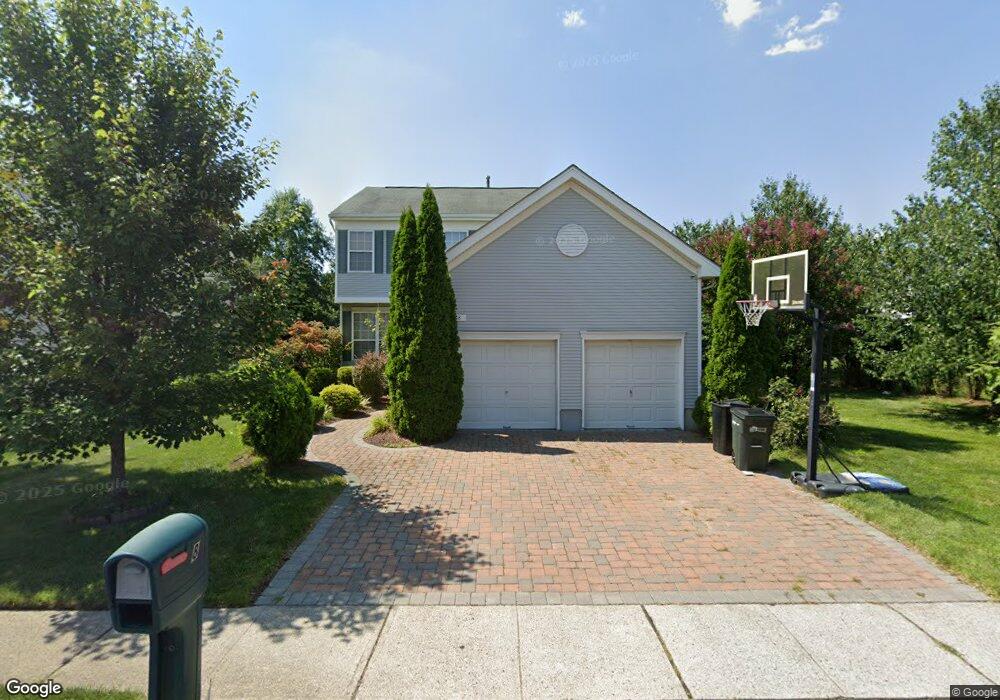
8 Devon Dr East Brunswick, NJ 08816
Estimated Value: $694,125 - $1,010,000
4
Beds
3
Baths
2,048
Sq Ft
$413/Sq Ft
Est. Value
About This Home
This home is located at 8 Devon Dr, East Brunswick, NJ 08816 and is currently estimated at $846,781, approximately $413 per square foot. 8 Devon Dr is a home located in Middlesex County with nearby schools including Murray A. Chittick Elementary School, Hammarskjold Upper Elementary School, and Churchill Junior High School.
Ownership History
Date
Name
Owned For
Owner Type
Purchase Details
Closed on
Dec 13, 2011
Sold by
Mo Ping and Li Qiong
Bought by
Wang Yanli
Current Estimated Value
Home Financials for this Owner
Home Financials are based on the most recent Mortgage that was taken out on this home.
Original Mortgage
$368,448
Interest Rate
4.4%
Mortgage Type
FHA
Purchase Details
Closed on
May 20, 1998
Sold by
Hovnanian K
Bought by
Mo Ping and Qiong Li
Home Financials for this Owner
Home Financials are based on the most recent Mortgage that was taken out on this home.
Original Mortgage
$194,450
Interest Rate
7.02%
Create a Home Valuation Report for This Property
The Home Valuation Report is an in-depth analysis detailing your home's value as well as a comparison with similar homes in the area
Home Values in the Area
Average Home Value in this Area
Purchase History
| Date | Buyer | Sale Price | Title Company |
|---|---|---|---|
| Wang Yanli | $456,000 | Chicago Title Insurance Co | |
| Mo Ping | $243,114 | -- |
Source: Public Records
Mortgage History
| Date | Status | Borrower | Loan Amount |
|---|---|---|---|
| Previous Owner | Wang Yanli | $368,448 | |
| Previous Owner | Mo Ping | $194,450 |
Source: Public Records
Tax History
| Year | Tax Paid | Tax Assessment Tax Assessment Total Assessment is a certain percentage of the fair market value that is determined by local assessors to be the total taxable value of land and additions on the property. | Land | Improvement |
|---|---|---|---|---|
| 2025 | $15,877 | $130,200 | $35,000 | $95,200 |
| 2024 | $15,403 | $130,200 | $35,000 | $95,200 |
| 2023 | $15,403 | $130,200 | $35,000 | $95,200 |
| 2022 | $15,341 | $130,200 | $35,000 | $95,200 |
| 2021 | $14,904 | $130,200 | $35,000 | $95,200 |
| 2020 | $14,883 | $130,200 | $35,000 | $95,200 |
| 2019 | $14,724 | $130,200 | $35,000 | $95,200 |
| 2018 | $14,474 | $130,200 | $35,000 | $95,200 |
| 2017 | $14,241 | $130,200 | $35,000 | $95,200 |
| 2016 | $13,954 | $130,200 | $35,000 | $95,200 |
| 2015 | $13,625 | $130,200 | $35,000 | $95,200 |
| 2014 | $13,331 | $130,200 | $35,000 | $95,200 |
Source: Public Records
Map
Nearby Homes
Your Personal Tour Guide
Ask me questions while you tour the home.