8 Goldfinch Ln Walpole, MA 02081
Walpole AreaEstimated Value: $948,000 - $1,198,000
About This Home
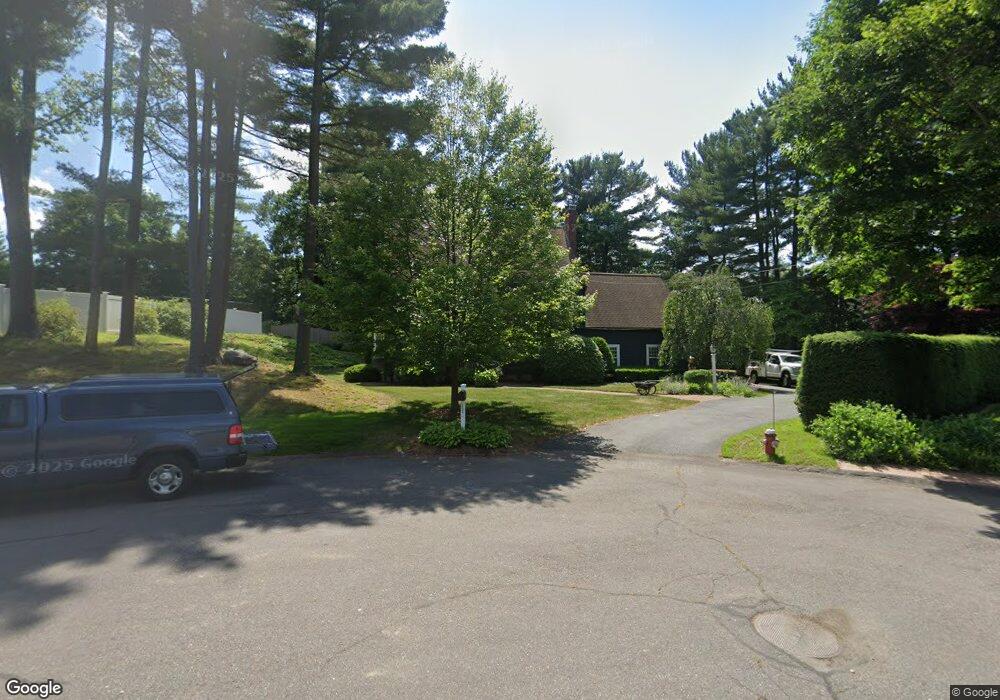
This home is located at 8 Goldfinch Ln, Walpole, MA 02081 and is currently estimated at $1,043,805, approximately $421 per square foot. 8 Goldfinch Ln is a home located in Norfolk County with nearby schools including Elm Street School, Eleanor N. Johnson Middle School, and Walpole High School.
Ownership History
We collect this data history from publicly available records. To have your information removed, we recommend requesting removal directly through your county’s website.
Purchase Details
Home Values in the Area
Average Home Value in this Area
Purchase History
We collect this data history from publicly available records. To have your information removed, we recommend requesting removal directly through your county’s website.
| Date | Buyer | Sale Price | Title Company |
|---|---|---|---|
| $257,500 | -- |
Tax History
We collect this data history from publicly available records. To have your information removed, we recommend requesting removal directly through your county’s website.
| Year | Tax Paid | Tax Assessment Tax Assessment Total Assessment is a certain percentage of the fair market value that is determined by local assessors to be the total taxable value of land and additions on the property. | Land | Improvement |
|---|---|---|---|---|
| 2025 | $10,893 | $849,000 | $369,000 | $480,000 |
| 2024 | $10,539 | $797,200 | $354,800 | $442,400 |
| 2023 | $10,030 | $722,100 | $308,500 | $413,600 |
| 2022 | $9,382 | $648,800 | $285,800 | $363,000 |
| 2021 | $9,219 | $621,200 | $269,500 | $351,700 |
| 2020 | $8,862 | $591,200 | $254,300 | $336,900 |
| 2019 | $8,553 | $566,400 | $244,500 | $321,900 |
| 2018 | $8,365 | $547,800 | $236,000 | $311,800 |
| 2017 | $8,131 | $530,400 | $227,000 | $303,400 |
| 2016 | $7,764 | $499,000 | $209,500 | $289,500 |
| 2015 | $7,470 | $475,800 | $199,700 | $276,100 |
| 2014 | $7,623 | $483,700 | $199,700 | $284,000 |
Map
- 14 Brown Dr
- 1429 Main St Unit 5E
- 24 Marion St
- 75 William St
- 145 South St Unit 6
- 120 Spring St
- 85 Lewis Ave Unit 85
- 85 Lewis Ave
- 124 Clear Pond Dr
- 8 Teal Cir
- 7 Canvasback Way
- 8 Canvasback Way Unit 8
- 24 Riverside Place
- 85 Broad St
- 278 Common St
- 16 Weathervane Dr Unit 23
- 18 Weathervane Dr Unit 24
- 21 Grover St
- 201 Stone St
- 10 Forrest Rd
Ask me questions while you tour the home.