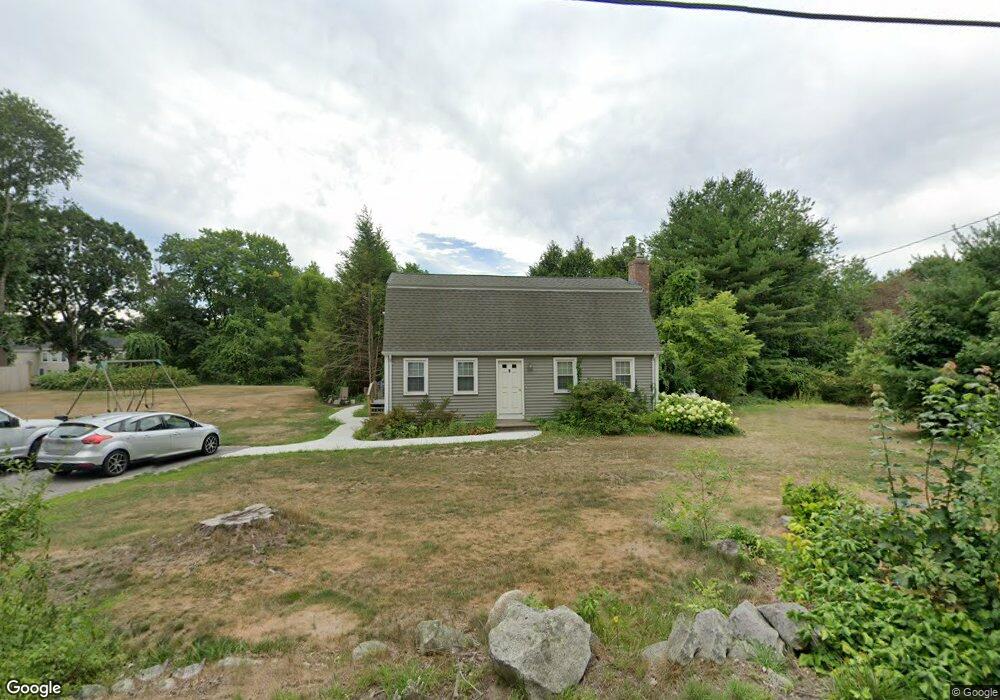
8 Grove St Bellingham, MA 02019
Estimated Value: $509,000 - $554,000
About This Home
This home is located at 8 Grove St, Bellingham, MA 02019 and is currently estimated at $525,336, approximately $330 per square foot. 8 Grove St is a home located in Norfolk County with nearby schools including Stall Brook Elementary School, Bellingham High School, and Bethany Christian Academy.
Ownership History
We collect this data history from publicly available records. To have your information removed, we recommend requesting removal directly through your county’s website.
Purchase Details
Purchase Details
Home Values in the Area
Average Home Value in this Area
Purchase History
We collect this data history from publicly available records. To have your information removed, we recommend requesting removal directly through your county’s website.
| Date | Buyer | Sale Price | Title Company |
|---|---|---|---|
| -- | None Available | ||
| $43,900 | -- |
Mortgage History
We collect this data history from publicly available records. To have your information removed, we recommend requesting removal directly through your county’s website.
| Date | Status | Borrower | Loan Amount |
|---|---|---|---|
| Previous Owner | $40,000 | ||
| Previous Owner | $49,560 |
Tax History
We collect this data history from publicly available records. To have your information removed, we recommend requesting removal directly through your county’s website.
| Year | Tax Paid | Tax Assessment Tax Assessment Total Assessment is a certain percentage of the fair market value that is determined by local assessors to be the total taxable value of land and additions on the property. | Land | Improvement |
|---|---|---|---|---|
| 2025 | $4,945 | $393,700 | $129,900 | $263,800 |
| 2024 | $4,736 | $368,300 | $118,600 | $249,700 |
| 2023 | $4,565 | $349,800 | $112,900 | $236,900 |
| 2022 | $4,470 | $317,500 | $94,300 | $223,200 |
| 2021 | $4,330 | $300,500 | $94,300 | $206,200 |
| 2020 | $4,068 | $286,100 | $94,300 | $191,800 |
| 2019 | $3,980 | $280,100 | $94,300 | $185,800 |
| 2018 | $3,765 | $261,300 | $95,200 | $166,100 |
| 2017 | $3,661 | $255,300 | $95,200 | $160,100 |
| 2016 | $3,564 | $249,400 | $98,900 | $150,500 |
| 2015 | $3,426 | $240,400 | $95,200 | $145,200 |
| 2014 | $3,429 | $233,900 | $91,800 | $142,100 |
Map
- 35 Hartford Ave
- 0 Hartford Ave
- 387 S Main St
- 60 Wethersfield Rd
- 25 Warfield St
- 35 Cape Rd
- 42 Bruce Rd
- 5 Bates St
- 64 Monique Dr
- 95 Lisa Ann Dr
- 267 R S Main St
- 267 F S Main St
- 272 S Main St
- 86 Plain St
- 0 Hixon St Unit 73477486
- 114 Plain St
- 7 Tropeano Ct Unit 7
- 141 Beaver St
- 20 Beaver Pond Rd Unit 20
- 3 Dino Way Unit 3
Ask me questions while you tour the home.