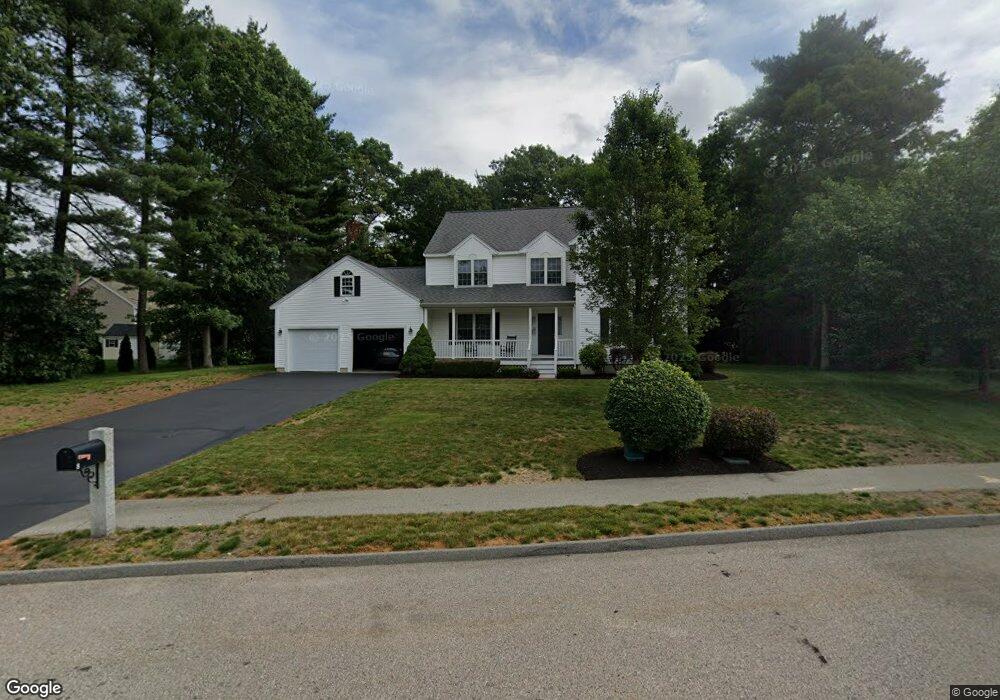
8 Queens Ct Walpole, MA 02081
Estimated Value: $901,000 - $1,153,000
4
Beds
3
Baths
2,260
Sq Ft
$451/Sq Ft
Est. Value
About This Home
This home is located at 8 Queens Ct, Walpole, MA 02081 and is currently estimated at $1,019,206, approximately $450 per square foot. 8 Queens Ct is a home located in Norfolk County with nearby schools including Boyden School, Eleanor N. Johnson Middle School, and Walpole High School.
Ownership History
Date
Name
Owned For
Owner Type
Purchase Details
Closed on
Jan 2, 2002
Sold by
Starr Rlty Inc
Bought by
Sundstrom Christopher and Sundstrom Tracey A
Current Estimated Value
Home Financials for this Owner
Home Financials are based on the most recent Mortgage that was taken out on this home.
Original Mortgage
$250,000
Outstanding Balance
$92,305
Interest Rate
6.72%
Mortgage Type
Purchase Money Mortgage
Estimated Equity
$926,901
Create a Home Valuation Report for This Property
The Home Valuation Report is an in-depth analysis detailing your home's value as well as a comparison with similar homes in the area
Home Values in the Area
Average Home Value in this Area
Purchase History
| Date | Buyer | Sale Price | Title Company |
|---|---|---|---|
| Sundstrom Christopher | $400,000 | -- |
Source: Public Records
Mortgage History
| Date | Status | Borrower | Loan Amount |
|---|---|---|---|
| Open | Sundstrom Christopher | $250,000 |
Source: Public Records
Tax History
| Year | Tax Paid | Tax Assessment Tax Assessment Total Assessment is a certain percentage of the fair market value that is determined by local assessors to be the total taxable value of land and additions on the property. | Land | Improvement |
|---|---|---|---|---|
| 2025 | $11,914 | $928,600 | $370,600 | $558,000 |
| 2024 | $11,509 | $870,600 | $356,200 | $514,400 |
| 2023 | $10,823 | $779,200 | $309,800 | $469,400 |
| 2022 | $9,977 | $690,000 | $286,900 | $403,100 |
| 2021 | $9,812 | $661,200 | $270,700 | $390,500 |
| 2020 | $9,504 | $634,000 | $255,400 | $378,600 |
| 2019 | $9,158 | $606,500 | $245,500 | $361,000 |
| 2018 | $8,873 | $581,100 | $236,600 | $344,500 |
| 2017 | $8,626 | $562,700 | $227,500 | $335,200 |
| 2016 | $8,398 | $539,700 | $219,900 | $319,800 |
| 2015 | $8,164 | $520,000 | $209,400 | $310,600 |
| 2014 | $7,913 | $502,100 | $209,400 | $292,700 |
Source: Public Records
Map
Nearby Homes
- 510 Common St
- 635 Old Post Rd Unit 303
- 0 U S Route 1
- 29 Clapp St
- 10 Country Club Dr
- 40 Neal St
- 19 Audubon Dr
- 19 Rainbow Pond Dr Unit B2
- 1391 Main St Unit 305
- 1391 Main St Unit 301
- 24 Marion St
- 65-67 Diamond St
- 120 Spring St
- 41-43 Stone St
- 6 Teal Cir
- 1108 Pennington Dr Unit 1108
- 1 Providence Hwy
- 7 Lilac Ct
- 124 Clear Pond Dr
- 2301 Pennington Dr Unit 2301
Your Personal Tour Guide
Ask me questions while you tour the home.