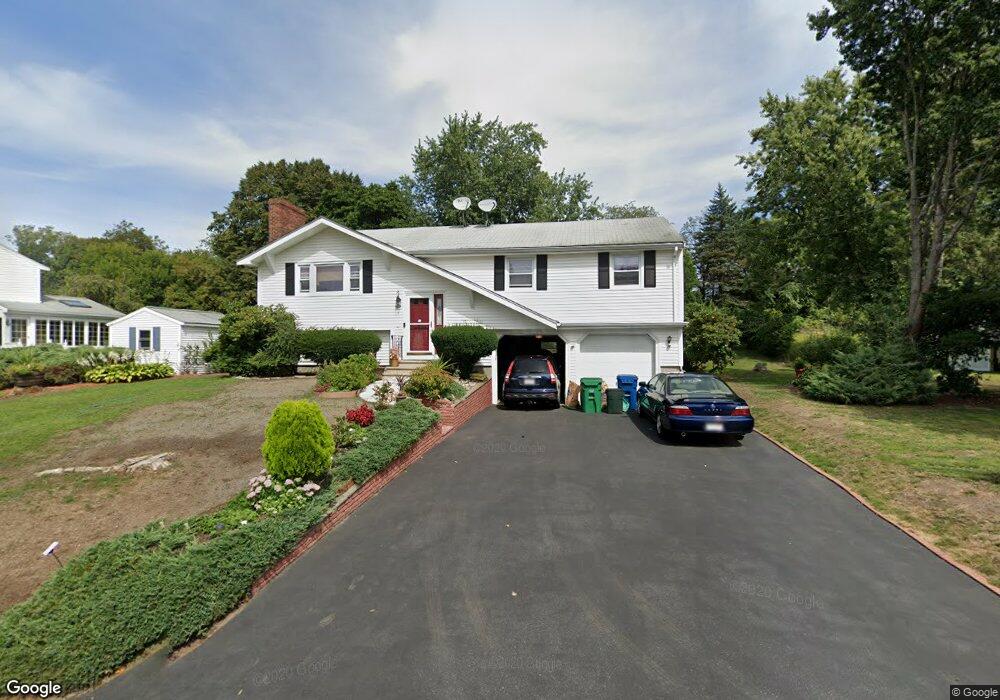
8 Rolling Ln Burlington, MA 01803
Burlington Town Center NeighborhoodEstimated Value: $816,414 - $923,000
3
Beds
3
Baths
1,858
Sq Ft
$465/Sq Ft
Est. Value
About This Home
This home is located at 8 Rolling Ln, Burlington, MA 01803 and is currently estimated at $864,854, approximately $465 per square foot. 8 Rolling Ln is a home located in Middlesex County with nearby schools including Burlington High School, Memorial Elementary School, and Marshall Simonds Middle School.
Ownership History
Date
Name
Owned For
Owner Type
Purchase Details
Closed on
Dec 30, 2010
Sold by
Giglio Sheila B and Mccarthy Barbara M
Bought by
Tran Tat Tay and Tran Jean Ty
Current Estimated Value
Home Financials for this Owner
Home Financials are based on the most recent Mortgage that was taken out on this home.
Original Mortgage
$332,500
Outstanding Balance
$222,197
Interest Rate
4.37%
Mortgage Type
Purchase Money Mortgage
Estimated Equity
$642,657
Create a Home Valuation Report for This Property
The Home Valuation Report is an in-depth analysis detailing your home's value as well as a comparison with similar homes in the area
Home Values in the Area
Average Home Value in this Area
Purchase History
| Date | Buyer | Sale Price | Title Company |
|---|---|---|---|
| Tran Tat Tay | $372,500 | -- |
Source: Public Records
Mortgage History
| Date | Status | Borrower | Loan Amount |
|---|---|---|---|
| Open | Tran Tat Tay | $332,500 |
Source: Public Records
Tax History
| Year | Tax Paid | Tax Assessment Tax Assessment Total Assessment is a certain percentage of the fair market value that is determined by local assessors to be the total taxable value of land and additions on the property. | Land | Improvement |
|---|---|---|---|---|
| 2025 | $6,416 | $740,900 | $460,100 | $280,800 |
| 2024 | $6,087 | $680,900 | $420,100 | $260,800 |
| 2023 | $5,777 | $614,600 | $364,100 | $250,500 |
| 2022 | $5,641 | $566,900 | $331,100 | $235,800 |
| 2021 | $5,481 | $550,900 | $315,100 | $235,800 |
| 2020 | $5,262 | $545,900 | $310,100 | $235,800 |
| 2019 | $5,312 | $506,900 | $290,100 | $216,800 |
| 2018 | $6,736 | $481,700 | $290,100 | $191,600 |
| 2017 | $5,025 | $481,700 | $290,100 | $191,600 |
| 2016 | $4,983 | $434,800 | $250,100 | $184,700 |
| 2015 | $4,926 | $434,000 | $250,100 | $183,900 |
| 2014 | $4,654 | $387,800 | $216,100 | $171,700 |
Source: Public Records
Map
Nearby Homes
Your Personal Tour Guide
Ask me questions while you tour the home.