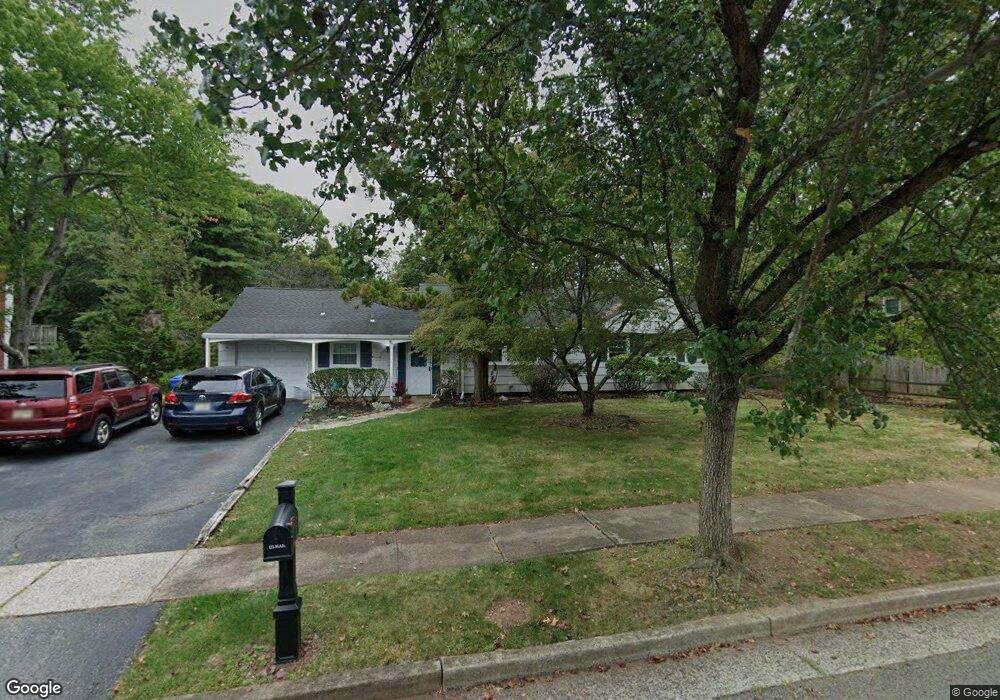
8 Rye St Piscataway, NJ 08854
Estimated Value: $515,687 - $616,000
Studio
--
Bath
1,456
Sq Ft
$395/Sq Ft
Est. Value
About This Home
This home is located at 8 Rye St, Piscataway, NJ 08854 and is currently estimated at $575,172, approximately $395 per square foot. 8 Rye St is a home located in Middlesex County with nearby schools including Knollwood Elementary School, Martin Luther King Intermediate School, and Conackamack Middle School.
Ownership History
Date
Name
Owned For
Owner Type
Purchase Details
Closed on
May 3, 2012
Sold by
Best David and Best Debra
Bought by
Best Debra M
Current Estimated Value
Home Financials for this Owner
Home Financials are based on the most recent Mortgage that was taken out on this home.
Original Mortgage
$195,761
Outstanding Balance
$136,267
Interest Rate
4%
Mortgage Type
New Conventional
Estimated Equity
$438,905
Purchase Details
Closed on
Dec 13, 2002
Sold by
Novak Steven
Bought by
Best David and Best Debra
Home Financials for this Owner
Home Financials are based on the most recent Mortgage that was taken out on this home.
Original Mortgage
$232,000
Interest Rate
6.11%
Create a Home Valuation Report for This Property
The Home Valuation Report is an in-depth analysis detailing your home's value as well as a comparison with similar homes in the area
Home Values in the Area
Average Home Value in this Area
Purchase History
| Date | Buyer | Sale Price | Title Company |
|---|---|---|---|
| Best Debra M | -- | Kingdom Title | |
| Best David | $290,000 | -- |
Source: Public Records
Mortgage History
| Date | Status | Borrower | Loan Amount |
|---|---|---|---|
| Open | Best Debra M | $195,761 | |
| Previous Owner | Best David | $232,000 |
Source: Public Records
Tax History
| Year | Tax Paid | Tax Assessment Tax Assessment Total Assessment is a certain percentage of the fair market value that is determined by local assessors to be the total taxable value of land and additions on the property. | Land | Improvement |
|---|---|---|---|---|
| 2025 | $8,464 | $505,200 | $304,400 | $200,800 |
| 2024 | $8,625 | $432,500 | $196,400 | $236,100 |
| 2023 | $8,625 | $412,700 | $196,400 | $216,300 |
| 2022 | $8,693 | $386,000 | $196,400 | $189,600 |
| 2021 | $8,574 | $366,100 | $196,400 | $169,700 |
| 2020 | $8,281 | $354,500 | $186,400 | $168,100 |
| 2019 | $8,314 | $349,900 | $186,400 | $163,500 |
| 2018 | $7,915 | $333,700 | $186,400 | $147,300 |
| 2017 | $8,083 | $294,900 | $161,400 | $133,500 |
| 2016 | $7,933 | $294,900 | $161,400 | $133,500 |
| 2015 | $7,821 | $294,900 | $161,400 | $133,500 |
| 2014 | $7,644 | $294,900 | $161,400 | $133,500 |
Source: Public Records
Map
Nearby Homes
- 448 Hillside Ave
- 9 Nye Ct
- 424 Rivercrest Dr
- 4 Seymour Terrace
- 701 Sunbrite Ln
- 5265 Witherspoon St
- 2603 Wade St
- 2250 Plainfield Ave N
- 6 Long St
- 308 Bound Brook Ave
- 2401 Cooper St
- 80 Mitchell Ave
- 85 Mitchell Ave
- 117 Plainfield Ave
- 45 Mitchell Ave
- 7 3rd Ave
- 160 Stratton St S
- 127 Berkshire Ct
- 110 Castle Pointe Blvd
- 51 Cherrywood Dr
Your Personal Tour Guide
Ask me questions while you tour the home.