8 Souther Ln Salisbury, MA 01952
Salisbury AreaEstimated Value: $662,627 - $829,000
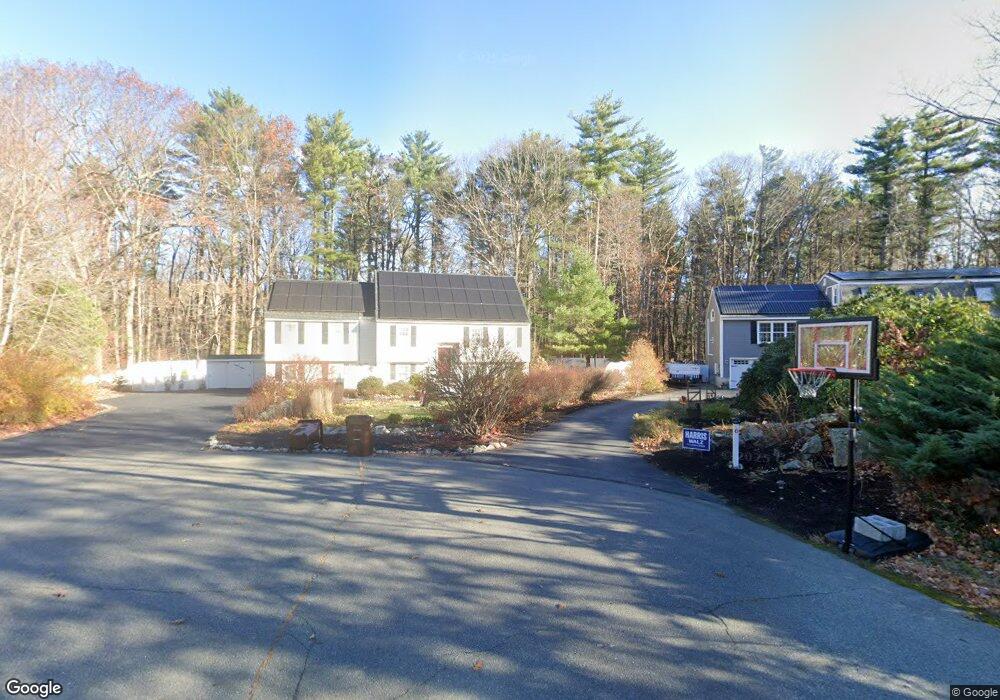
About This Home
This home is located at 8 Souther Ln, Salisbury, MA 01952 and is currently estimated at $715,907, approximately $316 per square foot. 8 Souther Ln is a home located in Essex County with nearby schools including Triton Regional High School.
Ownership History
We collect this data history from publicly available records. To have your information removed, we recommend requesting removal directly through your county’s website.
Purchase Details
Purchase Details
Home Values in the Area
Average Home Value in this Area
Purchase History
We collect this data history from publicly available records. To have your information removed, we recommend requesting removal directly through your county’s website.
| Date | Buyer | Sale Price | Title Company |
|---|---|---|---|
| -- | None Available | ||
| $60,900 | -- |
Mortgage History
We collect this data history from publicly available records. To have your information removed, we recommend requesting removal directly through your county’s website.
| Date | Status | Borrower | Loan Amount |
|---|---|---|---|
| Previous Owner | $102,000 |
Tax History
We collect this data history from publicly available records. To have your information removed, we recommend requesting removal directly through your county’s website.
| Year | Tax Paid | Tax Assessment Tax Assessment Total Assessment is a certain percentage of the fair market value that is determined by local assessors to be the total taxable value of land and additions on the property. | Land | Improvement |
|---|---|---|---|---|
| 2025 | $5,240 | $519,800 | $171,300 | $348,500 |
| 2024 | $4,866 | $465,600 | $171,300 | $294,300 |
| 2023 | $5,028 | $465,600 | $171,300 | $294,300 |
| 2022 | $4,604 | $413,300 | $156,100 | $257,200 |
| 2021 | $4,626 | $410,800 | $156,100 | $254,700 |
| 2020 | $4,390 | $383,100 | $156,100 | $227,000 |
| 2019 | $4,404 | $371,300 | $156,500 | $214,800 |
| 2018 | $4,317 | $366,500 | $156,500 | $210,000 |
| 2017 | $4,066 | $341,100 | $134,700 | $206,400 |
| 2016 | $3,837 | $328,800 | $128,100 | $200,700 |
| 2015 | $3,764 | $320,300 | $127,900 | $192,400 |
Map
- 22 Seabrook Rd
- 2 Winterberry Cir
- 4 Caitlin Cir Unit B
- 44 Seabrook Rd
- 10 Caitlin Cir
- 17 Mason Ln Unit 9
- 17 Mason Ln
- 30 Meadowview Ln Unit B
- 55 Lafayette Rd
- 64 Seabrook Rd
- 29 Kendell Ln
- 9 Lions Way
- 2 True Rd
- 66 Worthley Ave
- 1 Lions Way
- 1 Phoenix Way
- 3 & 5 Ferry Rd
- 6 Sea Spray Ln Unit 6
- 36 Elm St Unit 1
- 111 Beach Rd Unit 9
Ask me questions while you tour the home.