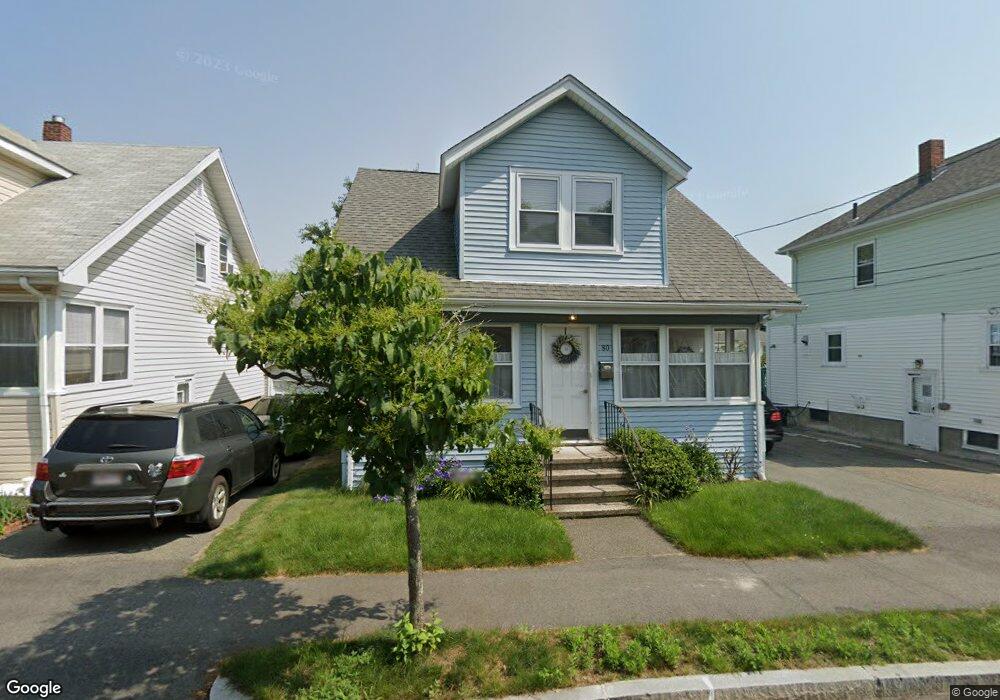
80 Edwin St Quincy, MA 02171
North Quincy NeighborhoodEstimated Value: $626,000 - $715,000
About This Home
This home is located at 80 Edwin St, Quincy, MA 02171 and is currently estimated at $672,099, approximately $537 per square foot. 80 Edwin St is a home located in Norfolk County with nearby schools including Francis W. Parker Elementary School, Atlantic Middle School, and North Quincy High School.
Ownership History
We collect this data history from publicly available records. To have your information removed, we recommend requesting removal directly through your county’s website.
Purchase Details
Purchase Details
Home Values in the Area
Average Home Value in this Area
Purchase History
We collect this data history from publicly available records. To have your information removed, we recommend requesting removal directly through your county’s website.
| Date | Buyer | Sale Price | Title Company |
|---|---|---|---|
| $135,000 | -- | ||
| $140,000 | -- |
Tax History
We collect this data history from publicly available records. To have your information removed, we recommend requesting removal directly through your county’s website.
| Year | Tax Paid | Tax Assessment Tax Assessment Total Assessment is a certain percentage of the fair market value that is determined by local assessors to be the total taxable value of land and additions on the property. | Land | Improvement |
|---|---|---|---|---|
| 2025 | $6,232 | $540,500 | $329,600 | $210,900 |
| 2024 | $6,070 | $538,600 | $329,600 | $209,000 |
| 2023 | $5,634 | $506,200 | $299,600 | $206,600 |
| 2022 | $5,217 | $435,500 | $239,700 | $195,800 |
| 2021 | $5,193 | $427,800 | $239,700 | $188,100 |
| 2020 | $5,144 | $413,800 | $235,000 | $178,800 |
| 2019 | $4,810 | $383,300 | $226,000 | $157,300 |
| 2018 | $4,881 | $365,900 | $215,200 | $150,700 |
| 2017 | $4,804 | $339,000 | $195,600 | $143,400 |
| 2016 | $4,588 | $319,500 | $177,900 | $141,600 |
| 2015 | $4,174 | $285,900 | $161,700 | $124,200 |
| 2014 | $4,054 | $272,800 | $161,700 | $111,100 |
Map
- 67 Colby Rd
- 101 Bayfield Rd S
- 54 Marshall St
- 72 French St
- 197 Billings St
- 210 Newbury Ave Unit 2L
- 24 Rawson Rd
- 260 Newbury Ave
- 94 Newbury Ave Unit 100
- 324 Atlantic St
- 99 Newbury Ave
- 153 Vassall St
- 2-4 Windsor Rd
- 84 Alstead St
- 185 Quincy Shore Dr Unit U44
- 175 Quincy Shore Dr Unit B33
- 175 Quincy Shore Dr Unit B66
- 175 Quincy Shore Dr Unit B74
- 41 Buckingham Rd
- 120 Holmes St Unit 304
Ask me questions while you tour the home.