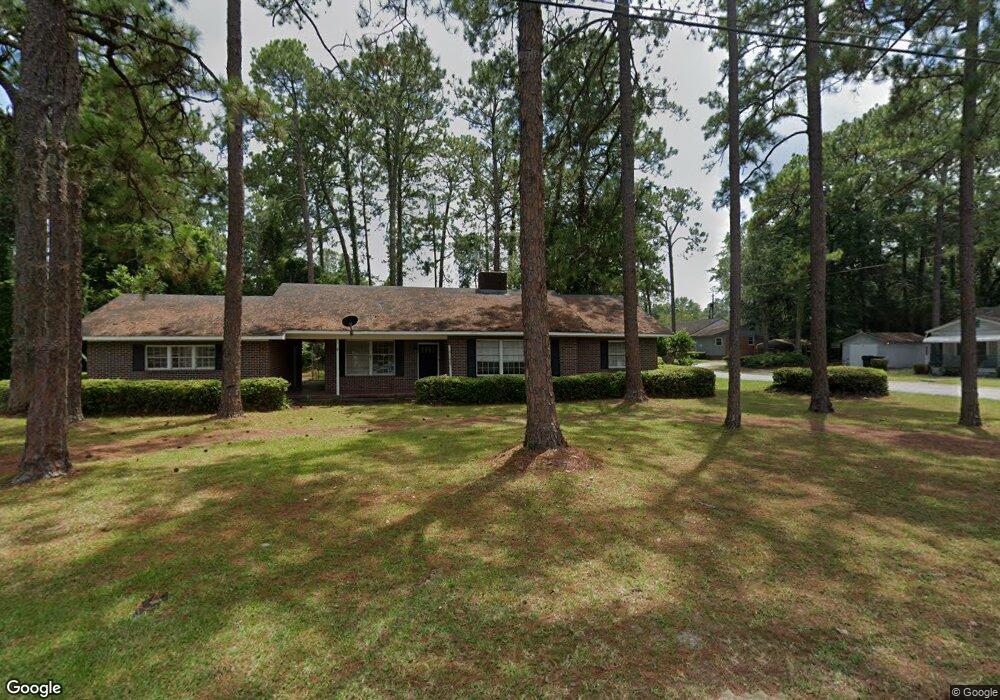
800 Atlantic Ave Waycross, GA 31501
Estimated Value: $192,159 - $221,000
3
Beds
2
Baths
1,627
Sq Ft
$125/Sq Ft
Est. Value
About This Home
This home is located at 800 Atlantic Ave, Waycross, GA 31501 and is currently estimated at $203,290, approximately $124 per square foot. 800 Atlantic Ave is a home located in Ware County with nearby schools including Williams Heights Elementary School, Waycross Middle School, and Ware County High School.
Ownership History
Date
Name
Owned For
Owner Type
Purchase Details
Closed on
Aug 10, 2021
Sold by
Duncan Sandra K
Bought by
Starling Chad L
Current Estimated Value
Purchase Details
Closed on
May 25, 2007
Sold by
Steedley Linda B
Bought by
Duncan Sandra K
Home Financials for this Owner
Home Financials are based on the most recent Mortgage that was taken out on this home.
Original Mortgage
$99,000
Interest Rate
6.16%
Mortgage Type
New Conventional
Purchase Details
Closed on
Jan 24, 2005
Sold by
Steedley Curtis N
Bought by
Steedley Linda B
Home Financials for this Owner
Home Financials are based on the most recent Mortgage that was taken out on this home.
Original Mortgage
$90,000
Interest Rate
5.66%
Mortgage Type
New Conventional
Purchase Details
Closed on
Mar 7, 2002
Sold by
Brice Joseph L and Brice Clarissa O
Bought by
Steedley Curtis N and Steedley Linda B
Purchase Details
Closed on
Apr 30, 2001
Sold by
Williams B F Mrs
Bought by
Brice Joseph L and Brice Clarissa O
Create a Home Valuation Report for This Property
The Home Valuation Report is an in-depth analysis detailing your home's value as well as a comparison with similar homes in the area
Purchase History
| Date | Buyer | Sale Price | Title Company |
|---|---|---|---|
| Starling Chad L | -- | -- | |
| Duncan Sandra K | $124,000 | -- | |
| Steedley Linda B | -- | -- | |
| Steedley Curtis N | $87,000 | -- | |
| Brice Joseph L | $78,300 | -- |
Source: Public Records
Mortgage History
| Date | Status | Borrower | Loan Amount |
|---|---|---|---|
| Previous Owner | Duncan Sandra K | $99,000 | |
| Previous Owner | Steedley Linda B | $90,000 |
Source: Public Records
Tax History
| Year | Tax Paid | Tax Assessment Tax Assessment Total Assessment is a certain percentage of the fair market value that is determined by local assessors to be the total taxable value of land and additions on the property. | Land | Improvement |
|---|---|---|---|---|
| 2025 | $2,182 | $64,574 | $11,360 | $53,214 |
| 2024 | $2,182 | $64,574 | $11,360 | $53,214 |
| 2023 | $2,227 | $57,455 | $5,224 | $52,231 |
| 2022 | $2,290 | $57,455 | $5,224 | $52,231 |
| 2021 | $2,077 | $48,027 | $5,224 | $42,803 |
| 2020 | $2,001 | $45,902 | $5,224 | $40,678 |
| 2019 | $1,888 | $42,713 | $5,224 | $37,489 |
| 2018 | $1,847 | $41,384 | $5,224 | $36,160 |
| 2017 | $1,804 | $41,384 | $5,224 | $36,160 |
| 2016 | $1,804 | $41,384 | $5,224 | $36,160 |
| 2015 | $1,817 | $41,384 | $5,224 | $36,160 |
| 2014 | $1,815 | $41,385 | $5,224 | $36,160 |
| 2013 | -- | $48,378 | $5,224 | $43,154 |
Source: Public Records
Map
Nearby Homes
- 713 Magnolia Dr
- 810 Saint Marys Dr
- 808 Satilla Blvd
- 619 Oakwood Ave
- 914 Baltimore Ave
- 1100 Atlantic Ave
- 808 Euclid Ave
- 0 Saint Marys Dr Unit (TRACT 2 0.25 ACRES)
- 1001 Baltimore Ave
- 707 Euclid Ave
- 1004 Hill St
- 1100 Euclid Ave
- 1500 Saint Marys Dr
- 1501 Satilla Blvd
- 1003 Scruggs St
- 1107 Euclid Ave
- 901 City Blvd
- 807 College St
- 1602 Saint Marys Dr
- 706 Cherokee Cir
- 802 Atlantic Ave
- 844 Saint Marys Dr
- 901 Saint Marys Dr
- 842 Saint Marys Dr
- 903 Saint Marys Dr
- 840 Saint Marys Dr
- 801 Atlantic Ave
- 838 Saint Marys Dr
- 803 Atlantic Ave
- 836 Saint Marys Dr
- 806 Atlantic Ave
- 805 Atlantic Ave
- 834 Saint Marys Dr
- 1001 Saint Marys Dr
- 830 Saint Marys Dr
- 912 Shadow Lawn
- 828 Saint Marys Dr
- 828 St Marys Dr
- 810 Atlantic Ave
- 709 Atlantic Ave
Your Personal Tour Guide
Ask me questions while you tour the home.