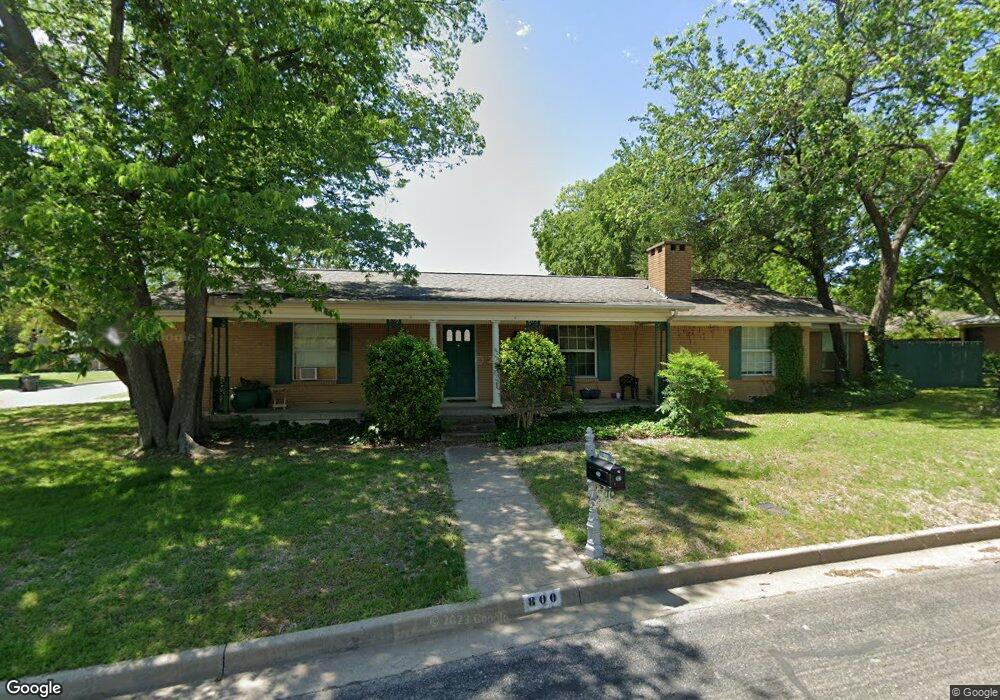
800 Cherry St Sanger, TX 76266
Estimated Value: $221,000 - $290,000
About This Home
This home is located at 800 Cherry St, Sanger, TX 76266 and is currently estimated at $252,901, approximately $154 per square foot. 800 Cherry St is a home located in Denton County with nearby schools including Chisholm Trail Elementary School, Clear Creek Intermediate School, and Sanger Sixth Grade Campus.
Ownership History
We collect this data history from publicly available records. To have your information removed, we recommend requesting removal directly through your county’s website.
Purchase Details
Home Financials for this Owner
Home Financials are based on the most recent Mortgage that was taken out on this home.Home Values in the Area
Average Home Value in this Area
Purchase History
We collect this data history from publicly available records. To have your information removed, we recommend requesting removal directly through your county’s website.
| Date | Buyer | Sale Price | Title Company |
|---|---|---|---|
| -- | Commonwealth Title Co |
Mortgage History
We collect this data history from publicly available records. To have your information removed, we recommend requesting removal directly through your county’s website.
| Date | Status | Borrower | Loan Amount |
|---|---|---|---|
| Open | $73,283 | ||
| Closed | $20,000 |
Tax History
We collect this data history from publicly available records. To have your information removed, we recommend requesting removal directly through your county’s website.
| Year | Tax Paid | Tax Assessment Tax Assessment Total Assessment is a certain percentage of the fair market value that is determined by local assessors to be the total taxable value of land and additions on the property. | Land | Improvement |
|---|---|---|---|---|
| 2025 | $834 | $140,873 | $66,308 | $74,565 |
| 2024 | $2,837 | $140,379 | $0 | $0 |
| 2023 | $746 | $127,617 | $51,573 | $89,244 |
| 2022 | $2,573 | $116,015 | $42,543 | $94,774 |
| 2021 | $2,217 | $125,183 | $34,808 | $90,375 |
| 2020 | $2,122 | $95,880 | $34,808 | $72,624 |
| 2019 | $1,985 | $87,164 | $34,808 | $76,589 |
| 2018 | $1,814 | $79,240 | $34,808 | $56,145 |
| 2017 | $1,657 | $72,036 | $34,808 | $49,362 |
| 2016 | $600 | $65,487 | $19,338 | $46,149 |
| 2015 | $638 | $60,837 | $19,338 | $41,499 |
| 2013 | -- | $73,952 | $19,338 | $54,614 |
Map
- 1010 Bolivar St
- 710 W Willow St
- 109 S 5th St
- 412 N 10th St
- 801 Pecan St
- 2300
- 507 N 7th St
- 1209 Bolivar St
- 411 Hughes St
- TBD Church St
- Tbd Church St
- 612 N 10th St
- 401 Peach St
- 610 S 10th St
- 511 N 2nd St
- 800 N 4th St
- TBD Farm To Market Road 455
- 4551 Farm To Market Road 455
- 2164 Farm To Market Road 455
- 614 N 2nd St
Ask me questions while you tour the home.