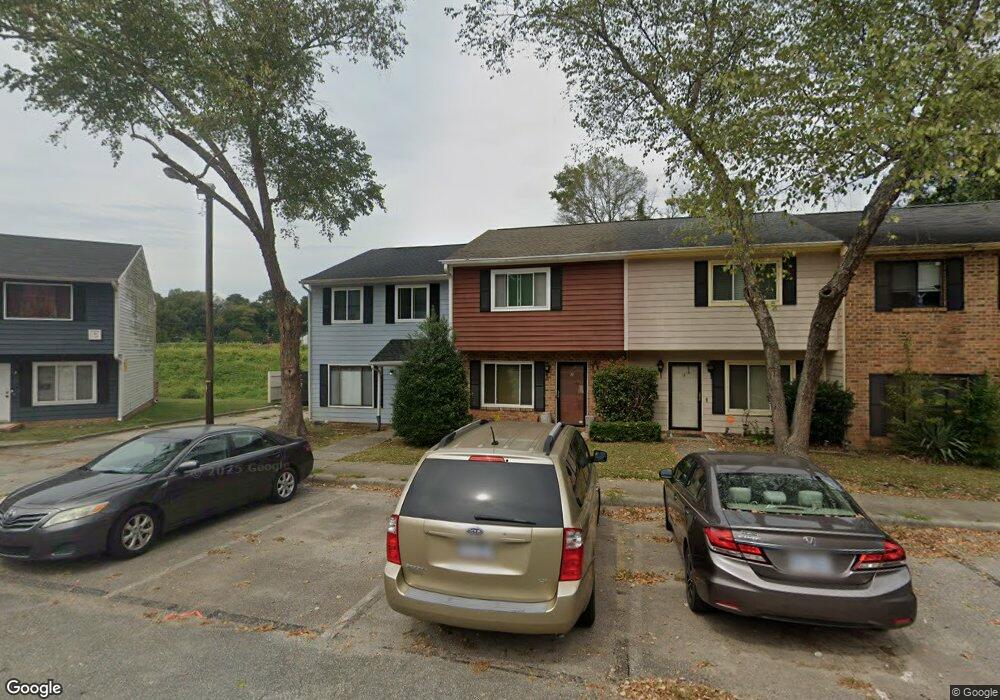
800 Fargo St Durham, NC 27707
Southside-Saint Teresa NeighborhoodEstimated Value: $204,000 - $254,000
2
Beds
1
Bath
1,112
Sq Ft
$204/Sq Ft
Est. Value
About This Home
This home is located at 800 Fargo St, Durham, NC 27707 and is currently estimated at $227,148, approximately $204 per square foot. 800 Fargo St is a home located in Durham County with nearby schools including Morehead Montessori, C. C. Spaulding Elementary, and Sherwood Githens Middle.
Ownership History
Date
Name
Owned For
Owner Type
Purchase Details
Closed on
Jul 23, 2024
Sold by
Sen Jhumki
Bought by
Lake Nathan Joseph
Current Estimated Value
Home Financials for this Owner
Home Financials are based on the most recent Mortgage that was taken out on this home.
Original Mortgage
$220,000
Outstanding Balance
$217,311
Interest Rate
6.87%
Mortgage Type
New Conventional
Estimated Equity
$9,837
Purchase Details
Closed on
Feb 16, 2023
Sold by
Manzo Alex Logan
Bought by
Sen Jhumki
Purchase Details
Closed on
Nov 20, 2020
Sold by
Prestige Home Solutions Llc
Bought by
Manzo Alex Logan
Home Financials for this Owner
Home Financials are based on the most recent Mortgage that was taken out on this home.
Original Mortgage
$15,510,300
Interest Rate
2.8%
Mortgage Type
New Conventional
Purchase Details
Closed on
Jun 11, 2020
Sold by
Sheffield Group Holdings Llc
Bought by
Prestige Home Solutions Llc
Purchase Details
Closed on
Jun 24, 2007
Sold by
Sheffield Tunecia
Bought by
Sheffield Group Holdings Llc
Create a Home Valuation Report for This Property
The Home Valuation Report is an in-depth analysis detailing your home's value as well as a comparison with similar homes in the area
Home Values in the Area
Average Home Value in this Area
Purchase History
| Date | Buyer | Sale Price | Title Company |
|---|---|---|---|
| Lake Nathan Joseph | $230,000 | Tryon Title | |
| Sen Jhumki | $210,000 | -- | |
| Manzo Alex Logan | $160,000 | None Available | |
| Prestige Home Solutions Llc | $56,000 | None Available | |
| Sheffield Group Holdings Llc | -- | None Available |
Source: Public Records
Mortgage History
| Date | Status | Borrower | Loan Amount |
|---|---|---|---|
| Open | Lake Nathan Joseph | $220,000 | |
| Previous Owner | Manzo Alex Logan | $15,510,300 |
Source: Public Records
Tax History
| Year | Tax Paid | Tax Assessment Tax Assessment Total Assessment is a certain percentage of the fair market value that is determined by local assessors to be the total taxable value of land and additions on the property. | Land | Improvement |
|---|---|---|---|---|
| 2025 | $2,161 | $217,972 | $50,000 | $167,972 |
| 2024 | $1,338 | $95,912 | $20,000 | $75,912 |
| 2023 | $1,256 | $95,912 | $20,000 | $75,912 |
| 2022 | $1,115 | $87,122 | $20,000 | $67,122 |
| 2021 | $1,110 | $87,122 | $20,000 | $67,122 |
| 2020 | $1,084 | $87,122 | $20,000 | $67,122 |
| 2019 | $1,084 | $87,122 | $20,000 | $67,122 |
| 2018 | $418 | $30,824 | $6,000 | $24,824 |
| 2017 | $415 | $30,824 | $6,000 | $24,824 |
| 2016 | $401 | $30,824 | $6,000 | $24,824 |
| 2015 | $704 | $50,833 | $10,300 | $40,533 |
| 2014 | $704 | $50,833 | $10,300 | $40,533 |
Source: Public Records
Map
Nearby Homes
- 914 South St
- 301 W Enterprise St
- 917 Scout Dr
- 1012 Manor Way
- 1014 Manor Way
- 1106 Fargo St
- 806 S Roxboro St
- 106 W Umstead St
- 108 Lodge St
- 518 Morehead Ave Unit 100
- 518 Morehead Ave Unit 200
- 518 Morehead Ave Unit 202
- 518 Morehead Ave Unit 101
- 518 Morehead Ave Unit 125
- 518 Morehead Ave Unit 504
- 518 Morehead Ave Unit 311
- 518 Morehead Ave Unit 127
- 518 Morehead Ave Unit 304
- 1406 South St
- 1408 South St
Your Personal Tour Guide
Ask me questions while you tour the home.