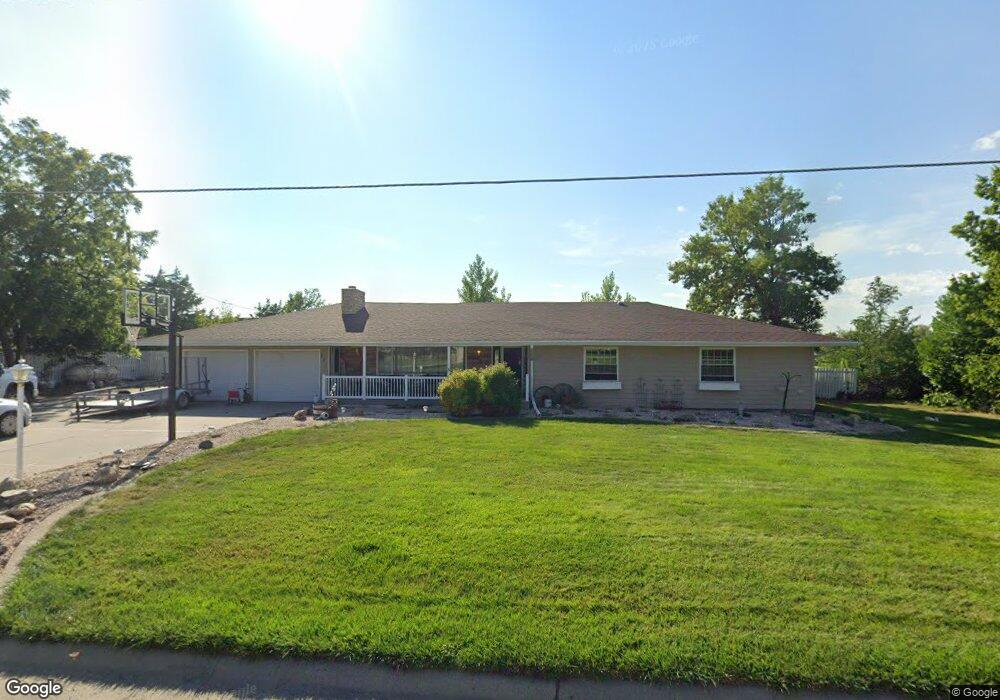
801 Maple St Chadron, NE 69337
Estimated Value: $281,000 - $438,000
5
Beds
2
Baths
2,129
Sq Ft
$184/Sq Ft
Est. Value
About This Home
This home is located at 801 Maple St, Chadron, NE 69337 and is currently estimated at $392,557, approximately $184 per square foot. 801 Maple St is a home located in Dawes County with nearby schools including Chadron Primary School, Chadron Intermediate School, and Chadron Middle School.
Ownership History
Date
Name
Owned For
Owner Type
Purchase Details
Closed on
Jan 29, 2016
Sold by
Lesher Roberta and Huckfeldt Connie
Bought by
Gooder Scott K
Current Estimated Value
Home Financials for this Owner
Home Financials are based on the most recent Mortgage that was taken out on this home.
Original Mortgage
$180,000
Outstanding Balance
$142,628
Interest Rate
4.01%
Mortgage Type
Purchase Money Mortgage
Estimated Equity
$249,929
Create a Home Valuation Report for This Property
The Home Valuation Report is an in-depth analysis detailing your home's value as well as a comparison with similar homes in the area
Home Values in the Area
Average Home Value in this Area
Purchase History
| Date | Buyer | Sale Price | Title Company |
|---|---|---|---|
| Gooder Scott K | $254,000 | Dawes County Abstract & Titl |
Source: Public Records
Mortgage History
| Date | Status | Borrower | Loan Amount |
|---|---|---|---|
| Open | Gooder Scott K | $180,000 |
Source: Public Records
Tax History
| Year | Tax Paid | Tax Assessment Tax Assessment Total Assessment is a certain percentage of the fair market value that is determined by local assessors to be the total taxable value of land and additions on the property. | Land | Improvement |
|---|---|---|---|---|
| 2025 | $4,971 | $358,920 | $74,725 | $284,195 |
| 2024 | $6,189 | $341,825 | $71,165 | $270,660 |
| 2023 | $6,189 | $341,825 | $71,165 | $270,660 |
| 2022 | $5,232 | $277,710 | $26,370 | $251,340 |
| 2021 | $5,079 | $263,320 | $27,690 | $235,630 |
| 2020 | $4,861 | $250,780 | $26,370 | $224,410 |
| 2019 | $4,802 | $250,780 | $26,370 | $224,410 |
| 2018 | $4,768 | $250,780 | $26,370 | $224,410 |
| 2017 | $4,707 | $250,780 | $26,370 | $224,410 |
| 2016 | $4,584 | $243,650 | $26,370 | $217,280 |
| 2015 | $4,533 | $243,650 | $26,370 | $217,280 |
| 2013 | $4,690 | $243,650 | $26,370 | $217,280 |
| 2012 | -- | $243,650 | $26,370 | $217,280 |
Source: Public Records
Map
Nearby Homes
Your Personal Tour Guide
Ask me questions while you tour the home.