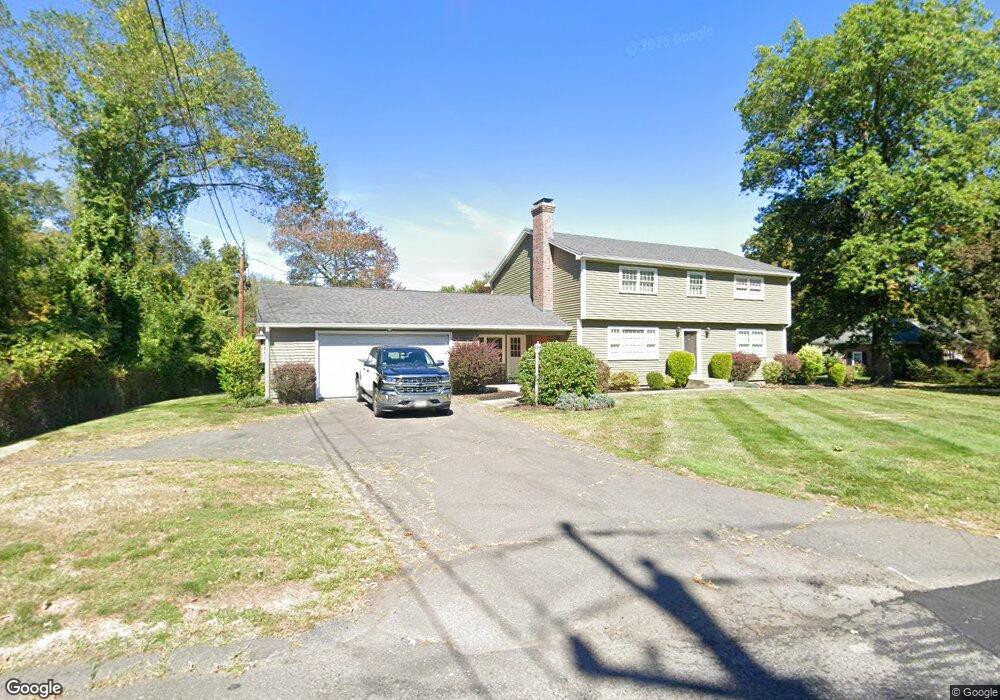
802 Morgan Rd West Springfield, MA 01089
West Springfield AreaEstimated Value: $500,000 - $583,000
About This Home
This home is located at 802 Morgan Rd, West Springfield, MA 01089 and is currently estimated at $540,031, approximately $209 per square foot. 802 Morgan Rd is a home located in Hampden County with nearby schools including West Springfield High School, Hampden Charter School of Science West, and St Thomas The Apostle School.
Ownership History
We collect this data history from publicly available records. To have your information removed, we recommend requesting removal directly through your county’s website.
Purchase Details
Home Financials for this Owner
Home Financials are based on the most recent Mortgage that was taken out on this home.Home Values in the Area
Average Home Value in this Area
Purchase History
We collect this data history from publicly available records. To have your information removed, we recommend requesting removal directly through your county’s website.
| Date | Buyer | Sale Price | Title Company |
|---|---|---|---|
| $245,000 | -- |
Mortgage History
We collect this data history from publicly available records. To have your information removed, we recommend requesting removal directly through your county’s website.
| Date | Status | Borrower | Loan Amount |
|---|---|---|---|
| Open | $178,000 | ||
| Closed | $196,000 | ||
| Previous Owner | $32,000 |
Tax History
We collect this data history from publicly available records. To have your information removed, we recommend requesting removal directly through your county’s website.
| Year | Tax Paid | Tax Assessment Tax Assessment Total Assessment is a certain percentage of the fair market value that is determined by local assessors to be the total taxable value of land and additions on the property. | Land | Improvement |
|---|---|---|---|---|
| 2025 | $6,018 | $404,700 | $117,600 | $287,100 |
| 2024 | $5,616 | $379,200 | $117,600 | $261,600 |
| 2023 | $5,332 | $343,100 | $117,600 | $225,500 |
| 2022 | $4,865 | $308,700 | $106,600 | $202,100 |
| 2021 | $4,663 | $275,900 | $85,600 | $190,300 |
| 2020 | $4,671 | $274,900 | $85,600 | $189,300 |
| 2019 | $4,662 | $274,900 | $85,600 | $189,300 |
| 2018 | $4,687 | $274,900 | $85,600 | $189,300 |
| 2017 | $4,687 | $274,900 | $85,600 | $189,300 |
| 2016 | $4,686 | $275,800 | $80,300 | $195,500 |
| 2015 | $4,599 | $270,700 | $78,900 | $191,800 |
| 2014 | $1,118 | $270,700 | $78,900 | $191,800 |
Map
- 24 Circle Dr
- 618 Morgan Rd
- 0 Ahiska Rd Unit 73477754
- 231 Edgewood Rd
- 492 Morgan Rd
- 72 Paulson Dr
- 291 Forest Glen
- 125 Lennys Way
- 42 Allison Ln
- 1386 Piper Rd
- 16 Hickory Hill
- 36 Shady Brook
- 20 Exeter St
- 18 Parkwood Dr
- 100 Beacon Hill Rd
- 514 Dewey St
- 105 Clayton Dr
- 63 Laurence Dr
- 10 Clayton Dr
- 13 Parkwood Dr
Ask me questions while you tour the home.