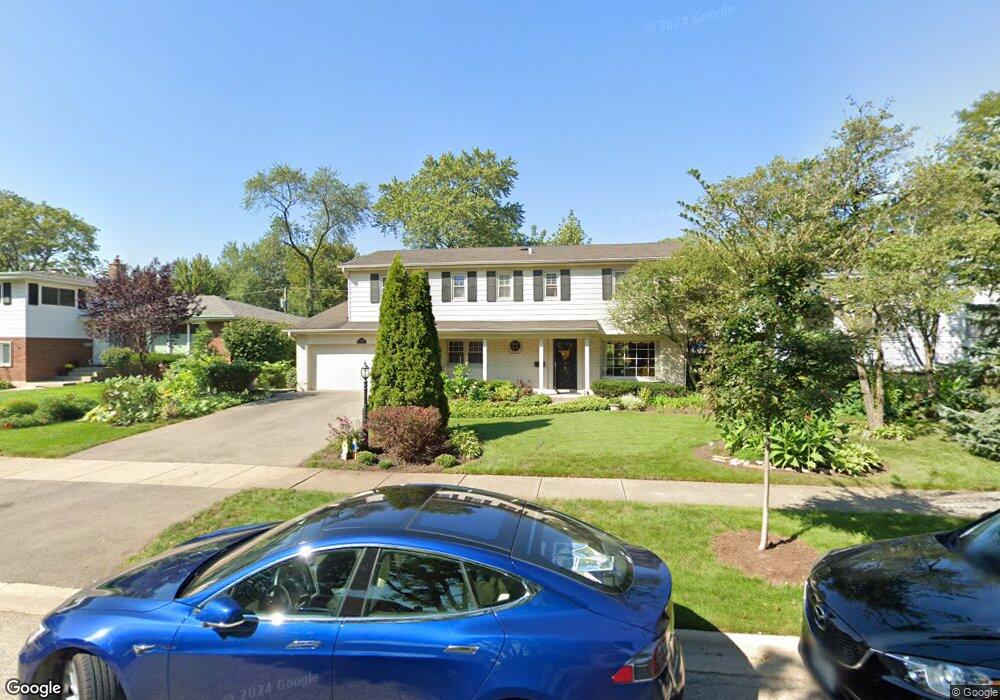
802 S Maple St Mount Prospect, IL 60056
Estimated Value: $638,000 - $713,000
4
Beds
3
Baths
2,653
Sq Ft
$255/Sq Ft
Est. Value
About This Home
This home is located at 802 S Maple St, Mount Prospect, IL 60056 and is currently estimated at $676,353, approximately $254 per square foot. 802 S Maple St is a home located in Cook County with nearby schools including Lions Park Elementary School, Lincoln Middle School, and Prospect High School.
Ownership History
Date
Name
Owned For
Owner Type
Purchase Details
Closed on
Jun 22, 1998
Sold by
Trapani Daniel J and Trapani Beth M
Bought by
Farrell William J and Farrell Hollis D
Current Estimated Value
Home Financials for this Owner
Home Financials are based on the most recent Mortgage that was taken out on this home.
Original Mortgage
$227,000
Outstanding Balance
$44,223
Interest Rate
7.75%
Estimated Equity
$632,130
Purchase Details
Closed on
Sep 6, 1994
Sold by
Broeren Richard A and Broeren Susan W
Bought by
Trapani Daniel J and Trapani Beth M
Home Financials for this Owner
Home Financials are based on the most recent Mortgage that was taken out on this home.
Original Mortgage
$130,000
Interest Rate
7.87%
Create a Home Valuation Report for This Property
The Home Valuation Report is an in-depth analysis detailing your home's value as well as a comparison with similar homes in the area
Home Values in the Area
Average Home Value in this Area
Purchase History
| Date | Buyer | Sale Price | Title Company |
|---|---|---|---|
| Farrell William J | $317,000 | -- | |
| Trapani Daniel J | $264,000 | -- |
Source: Public Records
Mortgage History
| Date | Status | Borrower | Loan Amount |
|---|---|---|---|
| Open | Farrell William J | $227,000 | |
| Previous Owner | Trapani Daniel J | $130,000 | |
| Closed | Farrell William J | $26,600 |
Source: Public Records
Tax History
| Year | Tax Paid | Tax Assessment Tax Assessment Total Assessment is a certain percentage of the fair market value that is determined by local assessors to be the total taxable value of land and additions on the property. | Land | Improvement |
|---|---|---|---|---|
| 2025 | $11,987 | $59,000 | $9,809 | $49,191 |
| 2024 | $11,987 | $49,000 | $8,174 | $40,826 |
| 2023 | $11,475 | $49,000 | $8,174 | $40,826 |
| 2022 | $11,475 | $49,000 | $8,174 | $40,826 |
| 2021 | $10,687 | $40,294 | $5,313 | $34,981 |
| 2020 | $11,348 | $40,294 | $5,313 | $34,981 |
| 2019 | $11,338 | $44,772 | $5,313 | $39,459 |
| 2018 | $11,698 | $41,671 | $4,495 | $37,176 |
| 2017 | $11,748 | $41,671 | $4,495 | $37,176 |
| 2016 | $10,716 | $42,833 | $4,495 | $38,338 |
| 2015 | $10,508 | $38,777 | $3,678 | $35,099 |
| 2014 | $11,009 | $41,095 | $3,678 | $37,417 |
| 2013 | $10,981 | $41,095 | $3,678 | $37,417 |
Source: Public Records
Map
Nearby Homes
- 108 W Sunset Rd
- 19 Marina Dr
- 703 Westmere Rd
- 508 W Lonnquist Blvd
- 447 S Elmhurst Rd
- 43 Inner Circle Dr
- 502 S I Oka Ave
- 381 W Millers Rd
- 901 S Can Dota Ave
- 500 W Huntington Commons Rd Unit 255
- 756 W Millers Rd
- 502 W Huntington Commons Rd Unit 443
- 250 Anita St
- 702 W Lonnquist Blvd
- 170 Westmere Rd
- 571 Dara James Rd
- 1103 S Hunt Club Dr Unit 129
- 1101 S Hunt Club Dr Unit 403
- 408 S Albert St
- 915 S Na wa ta Ave
- 804 S Maple St
- 800 S Maple St
- 803 S Emerson St
- 806 S Maple St
- 805 S Emerson St
- 801 S Emerson St
- 807 S Emerson St
- 803 S Maple St
- 201 E Lonnquist Blvd
- 805 S Maple St
- 808 S Maple St
- 809 S Emerson St
- 807 S Maple St
- 106 E Lonnquist Blvd
- 104 E Lonnquist Blvd
- 200 E Lonnquist Blvd
- 810 S Maple St
- 809 S Maple St
- 719 S Emerson St
- 204 E Lonnquist Blvd
Your Personal Tour Guide
Ask me questions while you tour the home.