Estimated Value: $460,388 - $582,000
Studio
3
Baths
2,289
Sq Ft
$217/Sq Ft
Est. Value
About This Home
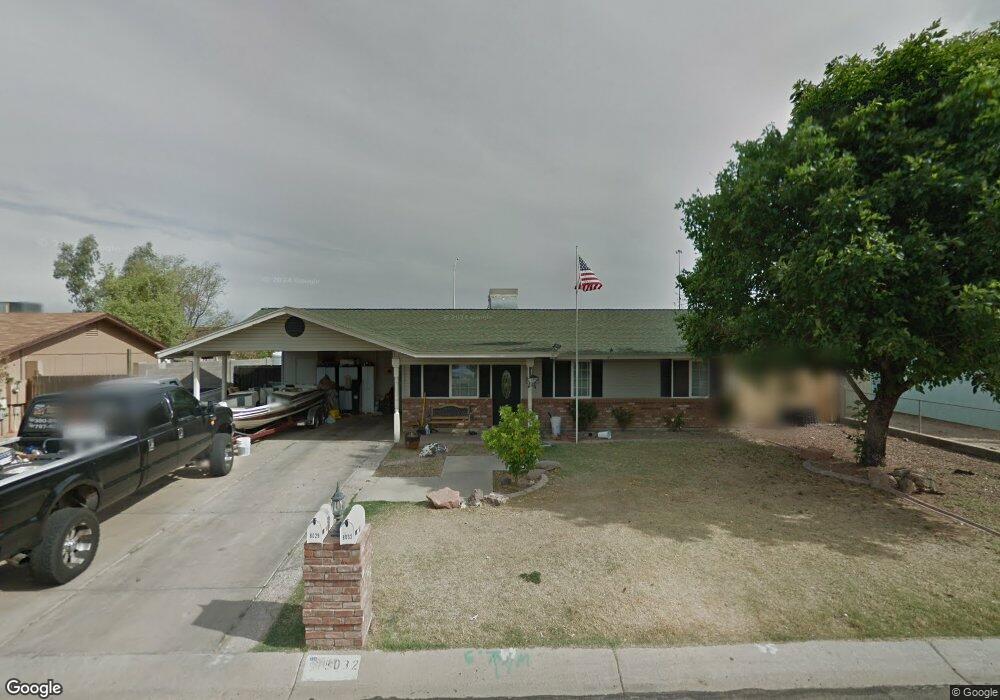
This home is located at 8032 E Inverness Ave, Mesa, AZ 85209 and is currently estimated at $496,347, approximately $216 per square foot. 8032 E Inverness Ave is a home located in Maricopa County with nearby schools including Jefferson Elementary School, Franklin at Brimhall Elementary School, and Franklin West Elementary School.
Ownership History
Date
Name
Owned For
Owner Type
Purchase Details
Closed on
Jun 13, 1996
Sold by
Hatch Tracy L
Bought by
Treck S and Norton Tami
Current Estimated Value
Create a Home Valuation Report for This Property
The Home Valuation Report is an in-depth analysis detailing your home's value as well as a comparison with similar homes in the area
Purchase History
| Date | Buyer | Sale Price | Title Company |
|---|---|---|---|
| Treck S | -- | -- |
Source: Public Records
Tax History
| Year | Tax Paid | Tax Assessment Tax Assessment Total Assessment is a certain percentage of the fair market value that is determined by local assessors to be the total taxable value of land and additions on the property. | Land | Improvement |
|---|---|---|---|---|
| 2025 | $1,279 | $14,712 | -- | -- |
| 2024 | $1,293 | $14,012 | -- | -- |
| 2023 | $1,293 | $34,720 | $6,940 | $27,780 |
| 2022 | $1,265 | $28,760 | $5,750 | $23,010 |
| 2021 | $1,296 | $29,450 | $5,890 | $23,560 |
| 2020 | $1,286 | $26,080 | $5,210 | $20,870 |
| 2019 | $1,210 | $23,520 | $4,700 | $18,820 |
| 2018 | $1,151 | $21,260 | $4,250 | $17,010 |
| 2017 | $1,121 | $19,660 | $3,930 | $15,730 |
| 2016 | $1,027 | $19,250 | $3,850 | $15,400 |
| 2015 | $1,037 | $14,900 | $2,980 | $11,920 |
Source: Public Records
Map
Nearby Homes
- 1705 S 82nd Place
- 1638 S 82nd Way
- 1654 S 82nd Way
- 8245 E Impala Ave
- 8321 E Impala Ave
- 1413 S Palo Verde St
- 7836 E Javelina Ave
- 1705 S 83rd Way
- 7722 E Harmony Ave
- 8103 E Southern Ave Unit 209
- 8103 E Southern Ave Unit 268
- 8103 E Southern Ave Unit 222
- 8103 E Southern Ave Unit 244
- 8103 E Southern Ave Unit 319
- 8103 E Southern Ave Unit 64
- 8103 E Southern Ave Unit 118
- 8103 E Southern Ave Unit 8
- 8103 E Southern Ave Unit 155
- 8103 E Southern Ave Unit 205
- 8103 E Southern Ave Unit 249
- 8038 E Inverness Ave
- 8026 E Inverness Ave
- 8020 E Inverness Ave
- 8029 E Inverness Ave
- 8037 E Inverness Ave
- 8023 E Inverness Ave
- 8043 E Inverness Ave
- 8052 E Inverness Ave
- 8012 E Inverness Ave
- 8015 E Inverness Avea Ave
- 8015 E Inverness Ave
- 8030 E Idaho Ave
- 8038 E Idaho Ave
- 8024 E Idaho Ave
- 8049 E Inverness Ave
- 8044 E Idaho Ave
- 8104 E Inverness Ave
- 8016 E Idaho Ave
- 1610 S 80th Place Unit 2B
Your Personal Tour Guide
Ask me questions while you tour the home.