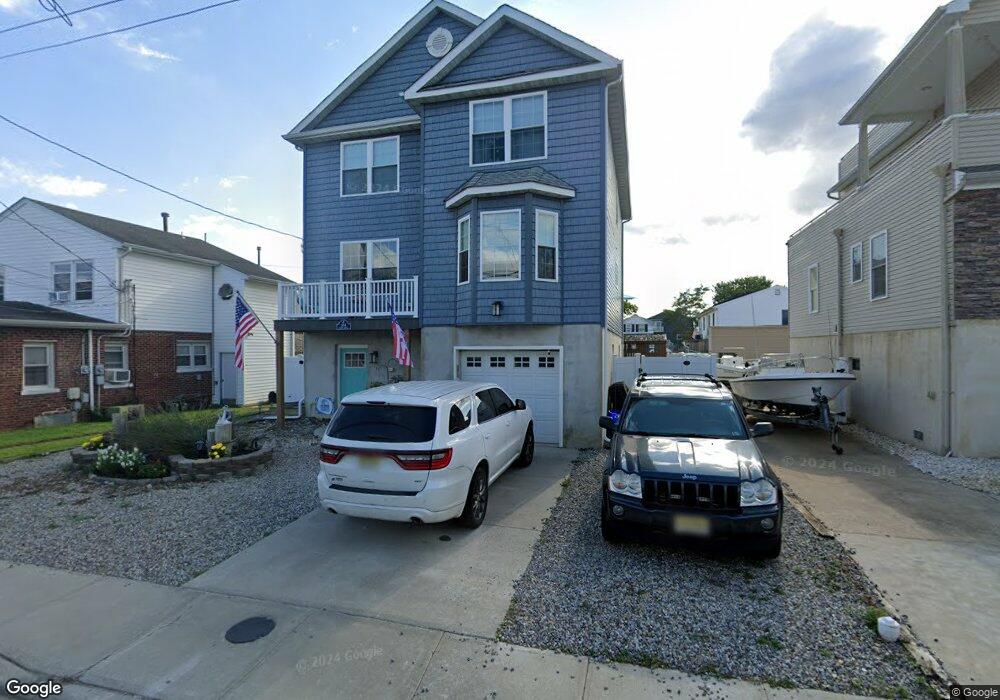
804 2nd St Union Beach, NJ 07735
Estimated Value: $640,000 - $694,000
3
Beds
2
Baths
2,140
Sq Ft
$312/Sq Ft
Est. Value
About This Home
This home is located at 804 2nd St, Union Beach, NJ 07735 and is currently estimated at $667,909, approximately $312 per square foot. 804 2nd St is a home located in Monmouth County with nearby schools including Memorial School and Baytul-Iman Academy.
Ownership History
Date
Name
Owned For
Owner Type
Purchase Details
Closed on
Apr 27, 2018
Sold by
Bayshore Development Llc
Bought by
Gajewski Matthew and Gajewski Megan
Current Estimated Value
Home Financials for this Owner
Home Financials are based on the most recent Mortgage that was taken out on this home.
Original Mortgage
$319,500
Outstanding Balance
$275,353
Interest Rate
4.44%
Mortgage Type
New Conventional
Estimated Equity
$392,556
Purchase Details
Closed on
Aug 9, 2016
Sold by
Bank Of America Na and Oconnor Eugene
Bought by
Bayshore Development Llc
Purchase Details
Closed on
Mar 14, 2008
Sold by
Florentine Barbara
Bought by
Oconnor Eugene and Oconnor Laura
Home Financials for this Owner
Home Financials are based on the most recent Mortgage that was taken out on this home.
Original Mortgage
$222,995
Interest Rate
5.76%
Mortgage Type
FHA
Purchase Details
Closed on
Aug 5, 2002
Sold by
Curtis Brian
Bought by
Florentine Barbara
Create a Home Valuation Report for This Property
The Home Valuation Report is an in-depth analysis detailing your home's value as well as a comparison with similar homes in the area
Home Values in the Area
Average Home Value in this Area
Purchase History
We collect this data history from publicly available records. To have your information removed, we recommend requesting removal directly through your county’s website.
| Date | Buyer | Sale Price | Title Company |
|---|---|---|---|
| Gajewski Matthew | $355,000 | Westcor Land Title Ins Co | |
| Bayshore Development Llc | $24,124 | None Available | |
| Oconnor Eugene | $226,500 | Multiple | |
| Florentine Barbara | $60,000 | -- |
Source: Public Records
Mortgage History
We collect this data history from publicly available records. To have your information removed, we recommend requesting removal directly through your county’s website.
| Date | Status | Borrower | Loan Amount |
|---|---|---|---|
| Open | Gajewski Matthew | $319,500 | |
| Previous Owner | Oconnor Eugene | $222,995 |
Source: Public Records
Tax History
| Year | Tax Paid | Tax Assessment Tax Assessment Total Assessment is a certain percentage of the fair market value that is determined by local assessors to be the total taxable value of land and additions on the property. | Land | Improvement |
|---|---|---|---|---|
| 2025 | $11,722 | $611,800 | $214,400 | $397,400 |
| 2024 | $11,485 | $568,500 | $186,400 | $382,100 |
| 2023 | $11,485 | $536,700 | $162,100 | $374,600 |
| 2022 | $10,134 | $463,700 | $120,100 | $343,600 |
| 2021 | $10,134 | $412,800 | $106,300 | $306,500 |
| 2020 | $9,709 | $385,900 | $96,300 | $289,600 |
| 2019 | $9,524 | $369,300 | $87,500 | $281,800 |
| 2018 | $3,421 | $127,500 | $80,000 | $47,500 |
| 2017 | $3,193 | $114,400 | $67,500 | $46,900 |
| 2016 | $3,324 | $119,200 | $70,000 | $49,200 |
| 2015 | $3,342 | $122,000 | $75,000 | $47,000 |
| 2014 | $3,521 | $106,000 | $77,800 | $28,200 |
Source: Public Records
Map
Nearby Homes
Your Personal Tour Guide
Ask me questions while you tour the home.