804 Moening St Delphos, OH 45833
Estimated Value: $121,000 - $133,000
About This Home
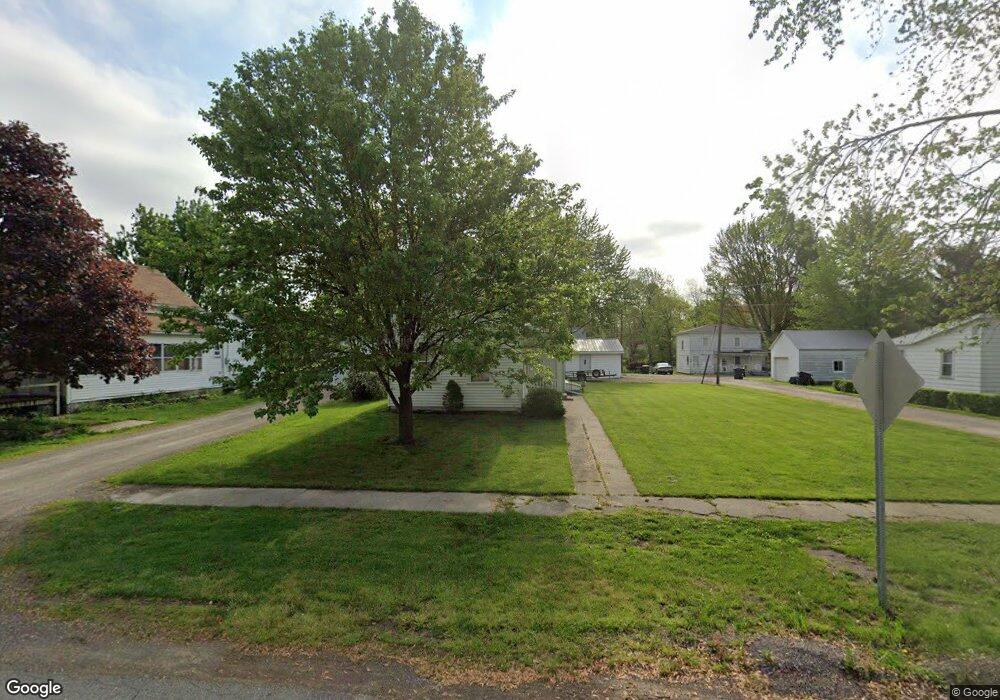
This home is located at 804 Moening St, Delphos, OH 45833 and is currently estimated at $127,192, approximately $106 per square foot. 804 Moening St is a home located in Allen County with nearby schools including Delphos St. John's High School and Delphos St. John's Elementary School.
Ownership History
We collect this data history from publicly available records. To have your information removed, we recommend requesting removal directly through your county’s website.
Purchase Details
Purchase Details
Home Financials for this Owner
Home Financials are based on the most recent Mortgage that was taken out on this home.Purchase Details
Home Financials for this Owner
Home Financials are based on the most recent Mortgage that was taken out on this home.Purchase Details
Home Values in the Area
Average Home Value in this Area
Purchase History
We collect this data history from publicly available records. To have your information removed, we recommend requesting removal directly through your county’s website.
| Date | Buyer | Sale Price | Title Company |
|---|---|---|---|
| $127,000 | None Listed On Document | ||
| $60,000 | None Available | ||
| $30,000 | -- | ||
| -- | -- |
Mortgage History
We collect this data history from publicly available records. To have your information removed, we recommend requesting removal directly through your county’s website.
| Date | Status | Borrower | Loan Amount |
|---|---|---|---|
| Previous Owner | $60,000 | ||
| Previous Owner | $25,795 |
Tax History
We collect this data history from publicly available records. To have your information removed, we recommend requesting removal directly through your county’s website.
| Year | Tax Paid | Tax Assessment Tax Assessment Total Assessment is a certain percentage of the fair market value that is determined by local assessors to be the total taxable value of land and additions on the property. | Land | Improvement |
|---|---|---|---|---|
| 2025 | $997 | $32,000 | $7,180 | $24,820 |
| 2024 | $995 | $32,000 | $7,180 | $24,820 |
| 2023 | $787 | $23,880 | $5,360 | $18,520 |
| 2022 | $806 | $23,880 | $5,360 | $18,520 |
| 2021 | $813 | $23,880 | $5,360 | $18,520 |
| 2020 | $695 | $21,600 | $5,110 | $16,490 |
| 2019 | $695 | $21,600 | $5,110 | $16,490 |
| 2018 | $691 | $21,600 | $5,110 | $16,490 |
| 2017 | $658 | $20,090 | $5,110 | $14,980 |
| 2016 | $672 | $20,090 | $5,110 | $14,980 |
| 2015 | $660 | $20,090 | $5,110 | $14,980 |
| 2014 | $660 | $19,950 | $4,900 | $15,050 |
| 2013 | $664 | $19,950 | $4,900 | $15,050 |
Map
- 610 N Washington St
- 201 E 5th St
- 904 E 2nd St
- 1114 Rozelle Ave
- 328 W 5th St
- 414 W 3rd St
- 221 S Main St
- 1000 Colettas Way
- 622 W 2nd St
- 424 S Canal St
- 483 S Franklin St
- 727 W 2nd St
- 528 S Main St
- 608 Davis St
- 7110 Elida Rd
- 227 W Clime St Unit Lot 59
- 1400 S Clay St Unit Lot 12
- 21198 Road V
- 19200 State Route 190
- 6225 Redd Rd
Ask me questions while you tour the home.